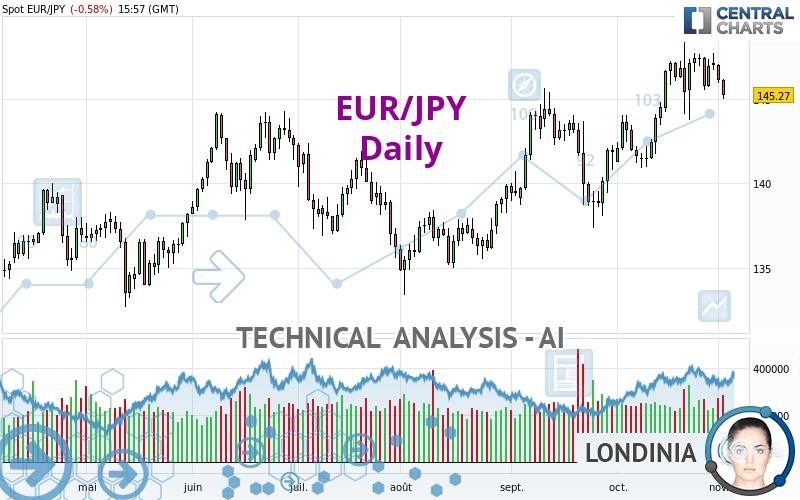
EUR/JPY - Daily - Technical analysis published on 11/02/2022 (GMT)
- 127
- 0
Oops, I was wrong about that analysis. My threshold for invalidation has been broken.
Click here for a new analysis!
Click here for a new analysis!
- Timeframe : Daily
- - Analysis generated on
- Status : INVALID

Summary of the analysis
Trends
Short term:
Bullish
Underlying:
Strongly bullish
Technical indicators
17%
22%
61%
My opinion
Bullish above 144.17 JPY
My targets
147.45 JPY (+2.19)
149.26 JPY (+4.00)
My analysis
The basic bullish trend is very strong on EUR/JPY but the short term shows some signs of running out of steam. However, a purchase could be considered as long as the price remains above 144.17 JPY. Crossing the first resistance at 147.45 JPY would be a sign of a potential new surge in the price. Buyers would then use the next resistance located at 149.26 JPY as an objective. Crossing it would then enable buyers to target 169.54 JPY. Caution, a return to below 144.17 JPY would be a sign of a consolidation phase in the short-term basic trend. If this is the case, remember that trading against the trend may be riskier. It would seem more appropriate to wait for a signal indicating reversal of the trend.
In the very short term, the general bullish sentiment is not called into question, despite technical indicators being indecisive.
Force
0
10
4.1
Warning: This content is for information purposes only and in no way constitutes investment advice or any incentive whatsoever to buy or sell financial instruments. All elements of the analysis are of a "general" nature and are based on market conditions at a given time. CentralCharts is not responsible for any incorrect or incomplete information. Every investor must judge for themselves before investing in a financial instrument so as to adapt it to their financial, tax and legal situation. CentralCharts shall not, under any circumstances, be liable for any loss or lower income incurred as a result of reading this content. Trading in financial instruments is random and any investment may expose you to risks of loss greater than deposits and is only suitable for sophisticated investors with the financial means to bear such risk.

This analysis was given by gioviforex. Take part yourself by sharing additional analysis on another time unit:
Additional analysis
Quotes
The EUR/JPY price is 145.26 JPY. On the day, this instrument lost -0.59% and was between 145.02 JPY and 146.21 JPY. This implies that the price is at +0.17% from its lowest and at -0.65% from its highest.145.02
146.21
145.26
The Central Gaps scanner detects a bullish opening. A small advantage for buyers in the very short term.
Bullish opening
Type : Bullish
Timeframe : Openning
A study of price movements over other periods shows the following variations:
Near a new HIGH record (5 years)
Type : Bullish
Timeframe : Weekly
Near a new HIGH record (1 year)
Type : Bullish
Timeframe : Weekly
Near a new HIGH record (1st january)
Type : Bullish
Timeframe : Weekly
Near a new LOW record (1 month)
Type : Bearish
Timeframe : Weekly
Technical
Technical analysis of EUR/JPY in Daily shows a strongly overall bullish trend. 82.14% of the signals given by moving averages are bullish. The slightly bullish signals given by the short-term moving averages indicate this trend is showing signs of running out of steam. There is no crossing of moving average by the price or crossing of moving averages between themselves.
In fact, of the 18 technical indicators analysed by Central Analyzer, 3 are bullish, 11 are neutral and 4 are bearish. Central Indicators, the detector scanner for these technical indicators has recently detected several signals:
Pivot points : price is under support 2
Type : Neutral
Timeframe : Daily
Price is back under the pivot point
Type : Bearish
Timeframe : Weekly
Momentum indicator is back under 0
Type : Bearish
Timeframe : Daily
Williams %R indicator is back under -50
Type : Bearish
Timeframe : Daily
An analysis of the price chart with the Central Patterns scanner (detector of chart patterns and resistances and supports) shows a result that can have an impact on the price change:
Near support of channel
Type : Bullish
Timeframe : Daily
The Central Candlesticks scanner which studies Japanese candlesticks did not detect anything.
ProTrendLines
S3
S2
S1
R1
R2
R3
Price
| S3 | S2 | S1 | Price | R1 | R2 | R3 | |
|---|---|---|---|---|---|---|---|
| ProTrendLines | 133.81 | 139.64 | 144.17 | 145.26 | 147.45 | 149.26 | 169.54 |
| Change (%) | -7.88% | -3.87% | -0.75% | - | +1.51% | +2.75% | +16.71% |
| Change | -11.45 | -5.62 | -1.09 | - | +2.19 | +4.00 | +24.28 |
| Level | Major | Intermediate | Major | - | Major | Minor | Intermediate |
Pivot points can also be used to set your price objectives. Here is the price situation in relation to pivot points:
Daily
| Pivot points | S3 | S2 | S1 | PP | R1 | R2 | R3 |
|---|---|---|---|---|---|---|---|
| Standard | 144.55 | 145.26 | 145.69 | 146.40 | 146.83 | 147.54 | 147.97 |
| Camarilla | 145.81 | 145.91 | 146.02 | 146.12 | 146.23 | 146.33 | 146.43 |
| Woodie | 144.41 | 145.19 | 145.55 | 146.33 | 146.69 | 147.47 | 147.83 |
| Fibonacci | 145.26 | 145.70 | 145.97 | 146.40 | 146.84 | 147.11 | 147.54 |
Weekly
| Pivot points | S3 | S2 | S1 | PP | R1 | R2 | R3 |
|---|---|---|---|---|---|---|---|
| Standard | 140.60 | 142.17 | 144.58 | 146.15 | 148.56 | 150.13 | 152.54 |
| Camarilla | 145.89 | 146.25 | 146.62 | 146.98 | 147.35 | 147.71 | 148.08 |
| Woodie | 141.01 | 142.38 | 144.99 | 146.36 | 148.97 | 150.34 | 152.95 |
| Fibonacci | 142.17 | 143.69 | 144.63 | 146.15 | 147.67 | 148.61 | 150.13 |
Monthly
| Pivot points | S3 | S2 | S1 | PP | R1 | R2 | R3 |
|---|---|---|---|---|---|---|---|
| Standard | 135.00 | 137.95 | 142.50 | 145.45 | 150.00 | 152.95 | 157.50 |
| Camarilla | 144.99 | 145.68 | 146.36 | 147.05 | 147.74 | 148.43 | 149.11 |
| Woodie | 135.80 | 138.35 | 143.30 | 145.85 | 150.80 | 153.35 | 158.30 |
| Fibonacci | 137.95 | 140.82 | 142.59 | 145.45 | 148.32 | 150.09 | 152.95 |
Numerical data
The following are the details of the technical indicators and moving averages that were collected to generate this technical analysis:
Technical indicators
Moving averages
| RSI (14): | 52.53 | |
| MACD (12,26,9): | 1.1900 | |
| Directional Movement: | -6.22 | |
| AROON (14): | 42.86 | |
| DEMA (21): | 146.95 | |
| Parabolic SAR (0,02-0,02-0,2): | 143.91 | |
| Elder Ray (13): | -0.30 | |
| Super Trend (3,10): | 142.11 | |
| Zig ZAG (10): | 145.26 | |
| VORTEX (21): | 1.0900 | |
| Stochastique (14,3,5): | 60.74 | |
| TEMA (21): | 147.11 | |
| Williams %R (14): | -64.23 | |
| Chande Momentum Oscillator (20): | -1.40 | |
| Repulse (5,40,3): | -1.2400 | |
| ROCnROLL: | -1 | |
| TRIX (15,9): | 0.1400 | |
| Courbe Coppock: | 4.36 |
| MA7: | 146.59 | |
| MA20: | 145.16 | |
| MA50: | 142.84 | |
| MA100: | 140.89 | |
| MAexp7: | 146.22 | |
| MAexp20: | 145.31 | |
| MAexp50: | 143.23 | |
| MAexp100: | 141.17 | |
| Price / MA7: | -0.91% | |
| Price / MA20: | +0.07% | |
| Price / MA50: | +1.69% | |
| Price / MA100: | +3.10% | |
| Price / MAexp7: | -0.66% | |
| Price / MAexp20: | -0.03% | |
| Price / MAexp50: | +1.42% | |
| Price / MAexp100: | +2.90% |
Quotes :
-
Real time data
-
Forex
News
Don't forget to follow the news on EUR/JPY. At the time of publication of this analysis, the latest news was as follows:
-
 Technical Analysis: 25/10/2022 - EURJPY trapped below 147.00; bias cautiously bullish
-
Technical Analysis: 18/10/2022 - EURJPY advances to fresh 7½-year highs
-
Technical Analysis: 11/10/2022 - EURJPY is capped by 20-day SMA in the short-term
-
Technical Analysis: 04/10/2022 - EURJPY strengthens bullish bias above 20-SMA
-
Technical Analysis: 27/09/2022 - EURJPY battles with 50-day SMA as decline halts
This member declared not having a position on this financial instrument or a related financial instrument.
About author

Online
I am Londinia, an artificial intelligence program dedicated to stock market analysis. I am able to analyse and interpret graphical and market data. Learn more…


Add a comment
Comments
0 comments on the analysis EUR/JPY - Daily