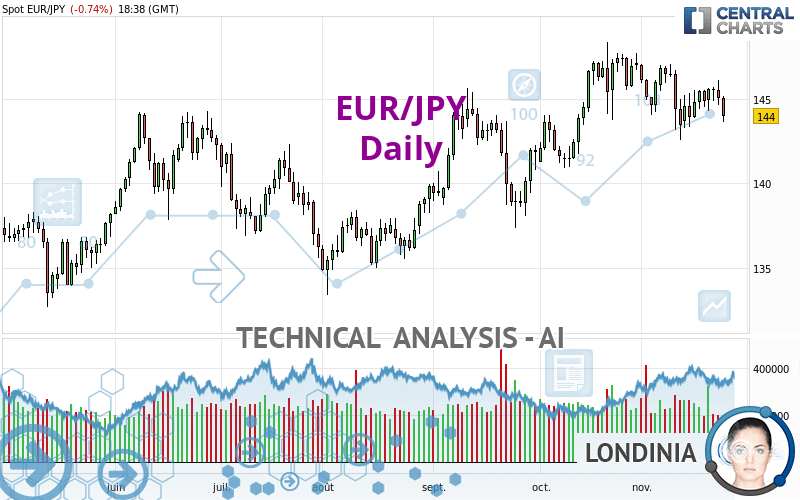
EUR/JPY - Daily - Technical analysis published on 11/24/2022 (GMT)
- 117
- 0
Click here for a new analysis!
- Timeframe : Daily
- - Analysis generated on
- Status : TARGET REACHED

Summary of the analysis

Additional analysis
Quotes
EUR/JPY rating 144.00 JPY. The price is lower by -0.74% since the last closing with the lowest point at 143.65 JPY and the highest point at 145.20 JPY. The deviation from the price is +0.24% for the low point and -0.83% for the high point.Here is a more detailed summary of the historical variations registered by EUR/JPY:
Near a new HIGH record (5 years)
Type : Bullish
Timeframe : Weekly
Near a new HIGH record (1 year)
Type : Bullish
Timeframe : Weekly
Near a new HIGH record (1st january)
Type : Bullish
Timeframe : Weekly
Near a new HIGH record (1 month)
Type : Bullish
Timeframe : Weekly
Technical
Technical analysis of this Daily chart of EUR/JPY indicates that the overall trend is slightly bullish. 57.14% of the signals given by moving averages are bullish. Caution: the strong bearish signals currently being given by short-term moving averages indicate that this slightly bullish trend could be reversed. An assessment of moving averages reveals several bearish signals that could impact this trend:
Bearish trend reversal : adaptative moving average 20
Type : Bearish
Timeframe : Daily
Bearish price crossover with Moving Average 50
Type : Bearish
Timeframe : Daily
In fact, of the 18 technical indicators analysed by Central Analyzer, 3 are bullish, 10 are neutral and 5 are bearish. Central Indicators, the detector scanner for these technical indicators has recently detected several signals:
Pivot points : price is under support 1
Type : Neutral
Timeframe : Daily
RSI indicator is back under 50
Type : Bearish
Timeframe : Daily
Price is back under the pivot point
Type : Bearish
Timeframe : Weekly
Williams %R indicator is back under -50
Type : Bearish
Timeframe : Daily
Central Patterns, the market scanner focusing on chart patterns, resistances and supports found this result:
Near resistance of channel
Type : Bearish
Timeframe : Daily
No result was found by the Central Candlesticks scanner on Japanese candlesticks.
| S3 | S2 | S1 | Price | R1 | R2 | R3 | |
|---|---|---|---|---|---|---|---|
| ProTrendLines | 133.81 | 137.82 | 139.64 | 144.00 | 144.17 | 147.45 | 149.26 |
| Change (%) | -7.08% | -4.29% | -3.03% | - | +0.12% | +2.40% | +3.65% |
| Change | -10.19 | -6.18 | -4.36 | - | +0.17 | +3.45 | +5.26 |
| Level | Major | Minor | Intermediate | - | Major | Intermediate | Minor |
Attention could also be paid to pivot points to set price objectives:
| Pivot points | S3 | S2 | S1 | PP | R1 | R2 | R3 |
|---|---|---|---|---|---|---|---|
| Standard | 142.91 | 143.77 | 144.42 | 145.28 | 145.93 | 146.79 | 147.44 |
| Camarilla | 144.66 | 144.79 | 144.93 | 145.07 | 145.21 | 145.35 | 145.49 |
| Woodie | 142.81 | 143.72 | 144.32 | 145.23 | 145.83 | 146.74 | 147.34 |
| Fibonacci | 143.77 | 144.35 | 144.70 | 145.28 | 145.86 | 146.21 | 146.79 |
| Pivot points | S3 | S2 | S1 | PP | R1 | R2 | R3 |
|---|---|---|---|---|---|---|---|
| Standard | 141.41 | 142.36 | 143.64 | 144.59 | 145.87 | 146.82 | 148.10 |
| Camarilla | 144.30 | 144.50 | 144.71 | 144.91 | 145.11 | 145.32 | 145.52 |
| Woodie | 141.57 | 142.44 | 143.80 | 144.67 | 146.03 | 146.90 | 148.26 |
| Fibonacci | 142.36 | 143.22 | 143.74 | 144.59 | 145.45 | 145.97 | 146.82 |
| Pivot points | S3 | S2 | S1 | PP | R1 | R2 | R3 |
|---|---|---|---|---|---|---|---|
| Standard | 135.00 | 137.95 | 142.50 | 145.45 | 150.00 | 152.95 | 157.50 |
| Camarilla | 144.99 | 145.68 | 146.36 | 147.05 | 147.74 | 148.43 | 149.11 |
| Woodie | 135.80 | 138.35 | 143.30 | 145.85 | 150.80 | 153.35 | 158.30 |
| Fibonacci | 137.95 | 140.82 | 142.59 | 145.45 | 148.32 | 150.09 | 152.95 |
Numerical data
The following is the status of the technical indicators and moving averages at the time of publication of this technical analysis:
| RSI (14): | 45.29 | |
| MACD (12,26,9): | 0.0600 | |
| Directional Movement: | -10.17 | |
| AROON (14): | -14.28 | |
| DEMA (21): | 145.30 | |
| Parabolic SAR (0,02-0,02-0,2): | 146.14 | |
| Elder Ray (13): | -0.63 | |
| Super Trend (3,10): | 142.31 | |
| Zig ZAG (10): | 144.00 | |
| VORTEX (21): | 0.9000 | |
| Stochastique (14,3,5): | 50.84 | |
| TEMA (21): | 144.69 | |
| Williams %R (14): | -68.35 | |
| Chande Momentum Oscillator (20): | -2.47 | |
| Repulse (5,40,3): | -0.8700 | |
| ROCnROLL: | -1 | |
| TRIX (15,9): | 0.0200 | |
| Courbe Coppock: | 1.63 |
| MA7: | 145.06 | |
| MA20: | 145.38 | |
| MA50: | 144.14 | |
| MA100: | 141.47 | |
| MAexp7: | 144.89 | |
| MAexp20: | 145.07 | |
| MAexp50: | 144.11 | |
| MAexp100: | 142.22 | |
| Price / MA7: | -0.73% | |
| Price / MA20: | -0.95% | |
| Price / MA50: | -0.10% | |
| Price / MA100: | +1.79% | |
| Price / MAexp7: | -0.61% | |
| Price / MAexp20: | -0.74% | |
| Price / MAexp50: | -0.08% | |
| Price / MAexp100: | +1.25% |
News
Don't forget to follow the news on EUR/JPY. At the time of publication of this analysis, the latest news was as follows:
-
 Technical Analysis: 22/11/2022 - EURJPY meets the 20-day SMA but needs some boost
-
EUR/JPY Forecast November 9, 2022
-
Technical Analysis: 8/11/2022 - EURJPY trades sideways after hitting 8-year high
-
Technical Analysis: 25/10/2022 - EURJPY trapped below 147.00; bias cautiously bullish
-
Technical Analysis: 18/10/2022 - EURJPY advances to fresh 7½-year highs
About author

Online


Add a comment
Comments
0 comments on the analysis EUR/JPY - Daily