EUR/JPY - Daily - Technical analysis published on 01/24/2020 (GMT)
- Who voted?
- 238
- 0
Click here for a new analysis!
- Timeframe : Daily
- - Analysis generated on
- Status : LEVEL MAINTAINED
Summary of the analysis

Additional analysis
Quotes
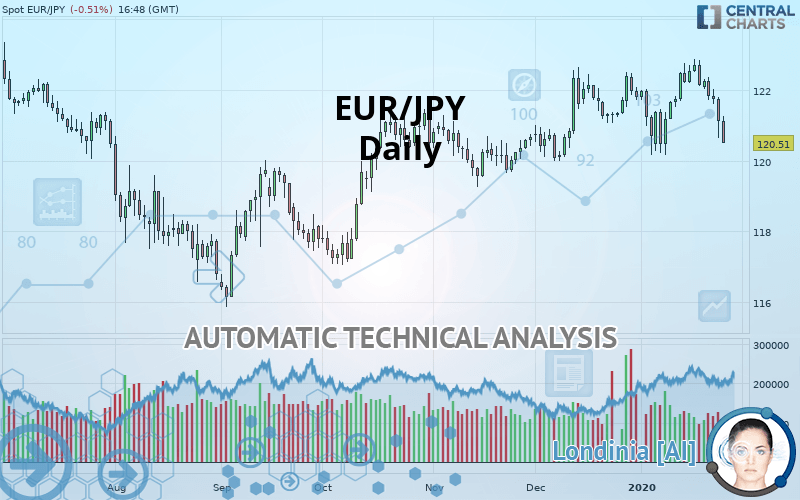
The EUR/JPY price is 120.51 JPY. On the day, this instrument lost -0.51% with the lowest point at 120.50 JPY and the highest point at 121.27 JPY. The deviation from the price is +0.01% for the low point and -0.63% for the high point.So that you have an overall view of the price change, here is a table showing the variations over several periods:
Technical
A technical analysis in Daily of this EUR/JPY chart shows a neutral trend. This indecision could turn into a bearish trend due to the strong bearish signals currently being given by short-term moving averages. The Central Indicators scanner detects bearish signals on moving averages that could impact this trend:
Bearish trend reversal : Moving Average 20
Type : Bearish
Timeframe : Daily
Bearish trend reversal : adaptative moving average 50
Type : Bearish
Timeframe : Daily
Bearish price crossover with Moving Average 50
Type : Bearish
Timeframe : Daily
Bearish price crossover with adaptative moving average 20
Type : Bearish
Timeframe : Daily
In fact, 10 technical indicators on 18 studied are currently bearish. Central Indicators, the scanner specialised in technical indicators, has identified these signals:
Pivot points : price is under support 1
Type : Neutral
Timeframe : Daily
Pivot points : price is under support 3
Type : Neutral
Timeframe : Weekly
RSI indicator is back under 50
Type : Bearish
Timeframe : Daily
Parabolic SAR indicator bearish reversal
Type : Bearish
Timeframe : Daily
Williams %R indicator is back under -50
Type : Bearish
Timeframe : Daily
The Central Patterns scanner, which studies chart patterns, resistances and supports, has identified these signals:
Horizontal support is broken
Type : Bearish
Timeframe : Daily
Support of channel is broken
Type : Bearish
Timeframe : Daily
The Central Candlesticks scanner which studies Japanese candlesticks did not detect anything.
| S3 | S2 | S1 | Price | R1 | R2 | R3 | |
|---|---|---|---|---|---|---|---|
| ProTrendLines | 117.21 | 118.41 | 120.45 | 120.51 | 121.47 | 122.38 | 123.47 |
| Change (%) | -2.74% | -1.74% | -0.05% | - | +0.80% | +1.55% | +2.46% |
| Change | -3.30 | -2.10 | -0.06 | - | +0.96 | +1.87 | +2.96 |
| Level | Intermediate | Minor | Major | - | Intermediate | Major | Minor |
To determine price objectives, it is also possible to use the pivot points. Here is the price position in relation to pivot points:
| Pivot points | S3 | S2 | S1 | PP | R1 | R2 | R3 |
|---|---|---|---|---|---|---|---|
| Standard | 119.40 | 120.02 | 120.57 | 121.19 | 121.74 | 122.36 | 122.91 |
| Camarilla | 120.81 | 120.92 | 121.02 | 121.13 | 121.24 | 121.34 | 121.45 |
| Woodie | 119.38 | 120.00 | 120.55 | 121.17 | 121.72 | 122.34 | 122.89 |
| Fibonacci | 120.02 | 120.46 | 120.74 | 121.19 | 121.63 | 121.91 | 122.36 |
| Pivot points | S3 | S2 | S1 | PP | R1 | R2 | R3 |
|---|---|---|---|---|---|---|---|
| Standard | 120.43 | 121.07 | 121.60 | 122.24 | 122.77 | 123.41 | 123.94 |
| Camarilla | 121.82 | 121.93 | 122.03 | 122.14 | 122.25 | 122.36 | 122.46 |
| Woodie | 120.39 | 121.04 | 121.56 | 122.21 | 122.73 | 123.38 | 123.90 |
| Fibonacci | 121.07 | 121.51 | 121.79 | 122.24 | 122.68 | 122.96 | 123.41 |
| Pivot points | S3 | S2 | S1 | PP | R1 | R2 | R3 |
|---|---|---|---|---|---|---|---|
| Standard | 117.64 | 118.82 | 120.30 | 121.48 | 122.96 | 124.14 | 125.62 |
| Camarilla | 121.06 | 121.30 | 121.55 | 121.79 | 122.03 | 122.28 | 122.52 |
| Woodie | 117.80 | 118.90 | 120.46 | 121.56 | 123.12 | 124.22 | 125.78 |
| Fibonacci | 118.82 | 119.83 | 120.46 | 121.48 | 122.49 | 123.12 | 124.14 |
Numerical data
The following is the status of technical indicators and moving averages registered at the time this technical analysis was created:
| RSI (14): | 40.16 | |
| MACD (12,26,9): | 0.0500 | |
| Directional Movement: | -11.17 | |
| AROON (14): | 42.85 | |
| DEMA (21): | 121.78 | |
| Parabolic SAR (0,02-0,02-0,2): | 122.83 | |
| Elder Ray (13): | -0.75 | |
| Super Trend (3,10): | 122.92 | |
| Zig ZAG (10): | 120.53 | |
| VORTEX (21): | 0.9500 | |
| Stochastique (14,3,5): | 35.85 | |
| TEMA (21): | 121.58 | |
| Williams %R (14): | -86.30 | |
| Chande Momentum Oscillator (20): | -0.64 | |
| Repulse (5,40,3): | -1.2200 | |
| ROCnROLL: | 2 | |
| TRIX (15,9): | 0.0200 | |
| Courbe Coppock: | 0.46 |
| MA7: | 121.77 | |
| MA20: | 121.69 | |
| MA50: | 121.23 | |
| MA100: | 120.36 | |
| MAexp7: | 121.48 | |
| MAexp20: | 121.64 | |
| MAexp50: | 121.26 | |
| MAexp100: | 120.91 | |
| Price / MA7: | -1.03% | |
| Price / MA20: | -0.97% | |
| Price / MA50: | -0.59% | |
| Price / MA100: | +0.12% | |
| Price / MAexp7: | -0.80% | |
| Price / MAexp20: | -0.93% | |
| Price / MAexp50: | -0.62% | |
| Price / MAexp100: | -0.33% |
News
Don"t forget to follow the news on EUR/JPY. At the time of publication of this analysis, the latest news was as follows:
-
 Weekly Technical Analysis: 04/11/2019 - GBPUSD, EURJPY, NZDUSD
-
FX Price Action Setups in EUR/USD, USD/CAD, EUR/JPY and GBP/JPY
-
Weekly Technical Analysis: 08/07/2019 - EURJPY, GBPUSD, NZDUSD
-
Weekly Technical Analysis: 10/06/2019 - GBPUSD, EURJPY, USDCHF
-
Weekly Technical Analysis: 20/05/2019 - USDJPY, GBPUSD, EURJPY
About author

Online


Add a comment
Comments
0 comments on the analysis EUR/JPY - Daily