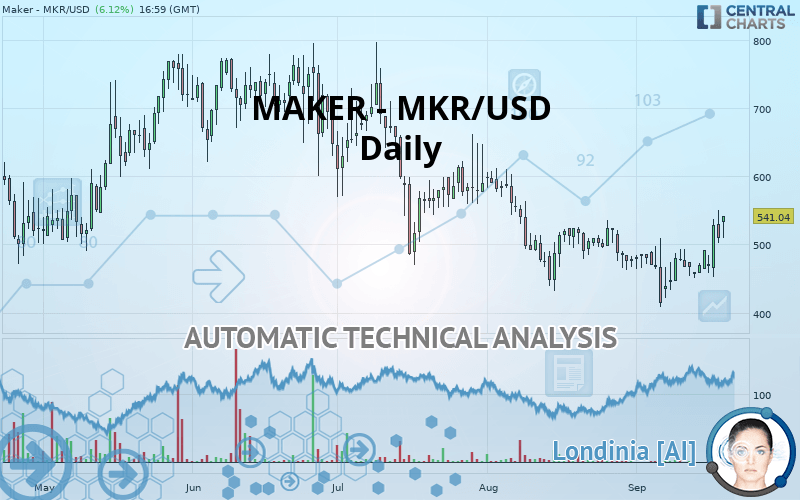
MAKER - MKR/USD - Daily - Technical analysis published on 09/19/2019 (GMT)
- Who voted?
- 177
- 0
Click here for a new analysis!
- Timeframe : Daily
- - Analysis generated on
- Status : INVALID

Summary of the analysis

Additional analysis
Quotes
MAKER - MKR/USD rating 541.04 USD. The price has increased by +6.12% since the last closing with the lowest point at 509.90 USD and the highest point at 541.30 USD. The deviation from the price is +6.11% for the low point and -0.05% for the high point.A bullish opening was detected by the Central Gaps scanner. Buyers are trying to impose a bullish momentum in the very short term.
Bullish opening
Type : Bullish
Timeframe : Openning
A study of price movements over other periods shows the following variations:
Near a new HIGH record (1 month)
Type : Bullish
Timeframe : Weekly
Technical
Technical analysis of this Daily chart of MAKER - MKR/USD indicates that the overall trend is slightly bearish. 57.14% of the signals given by moving averages are bearish. Caution: the strong bullish signals currently being given by short-term moving averages could quickly lead to a reversal of the trend. The Central Indicators market scanner is currently detecting a bearish signal that could impact this trend:
Bearish price crossover with adaptative moving average 50
Type : Bearish
Timeframe : Daily
In fact, 16 technical indicators on 18 studied are currently positioned bullish. Caution: the Central Indicators scanner currently detects an excess:
CCI indicator is overbought : over 100
Type : Neutral
Timeframe : Daily
Previous candle closed over Bollinger bands
Type : Neutral
Timeframe : Daily
Williams %R indicator is overbought : over -20
Type : Neutral
Timeframe : Daily
Pivot points : price is over resistance 1
Type : Neutral
Timeframe : Daily
Pivot points : price is over resistance 2
Type : Neutral
Timeframe : Weekly
Ichimoku : price is under the cloud
Type : Bearish
Timeframe : Daily
Price is back under the pivot point
Type : Bearish
Timeframe : Daily
An analysis of the price chart with the Central Patterns scanner (detector of chart patterns and resistances and supports) shows several results that can have an impact on the price change:
Near horizontal resistance
Type : Bearish
Timeframe : Daily
Resistance of channel is broken
Type : Bullish
Timeframe : Daily
No result was found by the Central Candlesticks scanner on Japanese candlesticks.
| S3 | S2 | S1 | Price | R1 | R2 | R3 | |
|---|---|---|---|---|---|---|---|
| ProTrendLines | 413.86 | 447.71 | 501.72 | 541.04 | 612.48 | 709.98 | 772.71 |
| Change (%) | -23.51% | -17.25% | -7.27% | - | +13.20% | +31.23% | +42.82% |
| Change | -127.18 | -93.33 | -39.32 | - | +71.44 | +168.94 | +231.67 |
| Level | Minor | Minor | Major | - | Intermediate | Major | Major |
Attention could also be paid to pivot points to set price objectives:
| Pivot points | S3 | S2 | S1 | PP | R1 | R2 | R3 |
|---|---|---|---|---|---|---|---|
| Standard | 442.96 | 472.35 | 491.10 | 520.49 | 539.24 | 568.63 | 587.38 |
| Camarilla | 496.62 | 501.03 | 505.45 | 509.86 | 514.27 | 518.69 | 523.10 |
| Woodie | 437.65 | 469.69 | 485.79 | 517.83 | 533.93 | 565.97 | 582.07 |
| Fibonacci | 472.35 | 490.74 | 502.10 | 520.49 | 538.88 | 550.24 | 568.63 |
| Pivot points | S3 | S2 | S1 | PP | R1 | R2 | R3 |
|---|---|---|---|---|---|---|---|
| Standard | 377.45 | 405.33 | 437.72 | 465.60 | 497.99 | 525.87 | 558.26 |
| Camarilla | 453.54 | 459.06 | 464.59 | 470.11 | 475.64 | 481.16 | 486.68 |
| Woodie | 379.71 | 406.46 | 439.98 | 466.73 | 500.25 | 527.00 | 560.52 |
| Fibonacci | 405.33 | 428.35 | 442.58 | 465.60 | 488.62 | 502.85 | 525.87 |
| Pivot points | S3 | S2 | S1 | PP | R1 | R2 | R3 |
|---|---|---|---|---|---|---|---|
| Standard | 222.57 | 327.10 | 402.56 | 507.09 | 582.55 | 687.08 | 762.54 |
| Camarilla | 428.53 | 445.03 | 461.53 | 478.03 | 494.53 | 511.03 | 527.53 |
| Woodie | 208.05 | 319.83 | 388.04 | 499.82 | 568.03 | 679.81 | 748.02 |
| Fibonacci | 327.10 | 395.85 | 438.33 | 507.09 | 575.84 | 618.32 | 687.08 |
Numerical data
The following is the status of technical indicators and moving averages registered at the time this technical analysis was created:
| RSI (14): | 60.34 | |
| MACD (12,26,9): | 2.8700 | |
| Directional Movement: | 9.07 | |
| AROON (14): | 85.72 | |
| DEMA (21): | 486.37 | |
| Parabolic SAR (0,02-0,02-0,2): | 436.71 | |
| Elder Ray (13): | 34.10 | |
| Super Trend (3,10): | 548.37 | |
| Zig ZAG (10): | 541.30 | |
| VORTEX (21): | 1.0300 | |
| Stochastique (14,3,5): | 86.39 | |
| TEMA (21): | 504.44 | |
| Williams %R (14): | -6.05 | |
| Chande Momentum Oscillator (20): | 102.60 | |
| Repulse (5,40,3): | 8.6800 | |
| ROCnROLL: | 1 | |
| TRIX (15,9): | -0.2400 | |
| Courbe Coppock: | 14.62 |
| MA7: | 494.96 | |
| MA20: | 475.88 | |
| MA50: | 501.52 | |
| MA100: | 577.86 | |
| MAexp7: | 503.66 | |
| MAexp20: | 488.31 | |
| MAexp50: | 509.40 | |
| MAexp100: | 547.80 | |
| Price / MA7: | +9.31% | |
| Price / MA20: | +13.69% | |
| Price / MA50: | +7.88% | |
| Price / MA100: | -6.37% | |
| Price / MAexp7: | +7.42% | |
| Price / MAexp20: | +10.80% | |
| Price / MAexp50: | +6.21% | |
| Price / MAexp100: | -1.23% |
About author

Online


Add a comment
Comments
0 comments on the analysis MAKER - MKR/USD - Daily