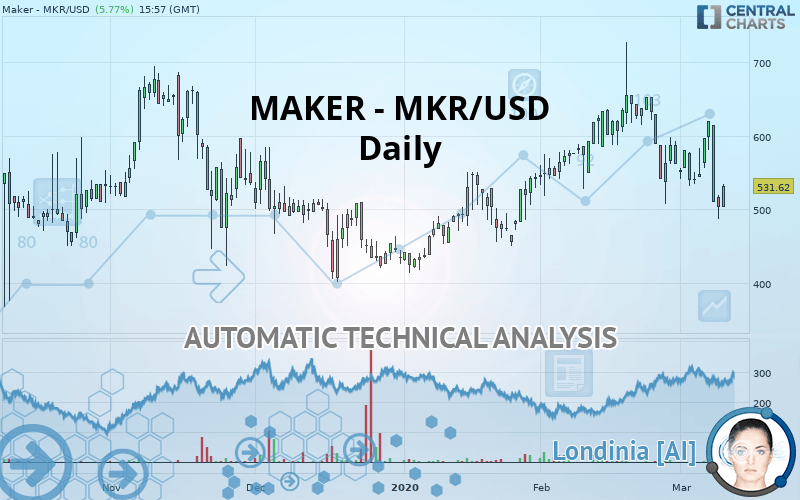
MAKER - MKR/USD - Daily - Technical analysis published on 03/10/2020 (GMT)
- Who voted?
- 195
- 0
Click here for a new analysis!
- Timeframe : Daily
- - Analysis generated on
- Status : TARGET REACHED

Summary of the analysis

Additional analysis
Quotes
MAKER - MKR/USD rating 531.62 USD. The price is lower by +5.77% since the last closing and was between 502.61 USD and 534.80 USD. This implies that the price is at +5.77% from its lowest and at -0.59% from its highest.So that you have an overall view of the price change, here is a table showing the variations over several periods:
Near a new LOW record (1 month)
Type : Bearish
Timeframe : Weekly
Technical
Technical analysis of MAKER - MKR/USD in Daily shows an overall slightly bearish trend. 60.71% of the signals given by moving averages are bearish. This slightly bearish trend could be reinforced by the strong bearish signals given by short-term moving averages. The Central Indicators market scanner is currently detecting a bearish signal that could impact this trend:
Bearish price crossover with adaptative moving average 100
Type : Bearish
Timeframe : Daily
In fact, 13 technical indicators on 18 studied are currently positioned bearish. Caution: the Central Indicators scanner currently detects an excess:
CCI indicator is oversold : under -100
Type : Neutral
Timeframe : Daily
Williams %R indicator is oversold : under -80
Type : Neutral
Timeframe : Daily
Pivot points : price is over resistance 1
Type : Neutral
Timeframe : Daily
Pivot points : price is under support 1
Type : Neutral
Timeframe : Weekly
Parabolic SAR indicator bearish reversal
Type : Bearish
Timeframe : Daily
Ichimoku : price is under the cloud
Type : Bearish
Timeframe : Daily
Price is back over the pivot point
Type : Bullish
Timeframe : Weekly
Price is back under the pivot point
Type : Bearish
Timeframe : Daily
An analysis of the price chart with the Central Patterns scanner (detector of chart patterns and resistances and supports) shows several results that can have an impact on the price change:
Horizontal resistance is broken
Type : Bullish
Timeframe : Daily
Support of channel is broken
Type : Bearish
Timeframe : Daily
No result was found by the Central Candlesticks scanner on Japanese candlesticks.
| S3 | S2 | S1 | Price | R1 | R2 | R3 | |
|---|---|---|---|---|---|---|---|
| ProTrendLines | 414.62 | 455.71 | 506.36 | 531.62 | 550.77 | 599.95 | 654.63 |
| Change (%) | -22.01% | -14.28% | -4.75% | - | +3.60% | +12.85% | +23.14% |
| Change | -117.00 | -75.91 | -25.26 | - | +19.15 | +68.33 | +123.01 |
| Level | Major | Intermediate | Major | - | Intermediate | Minor | Intermediate |
To determine price objectives, it is also possible to use the pivot points. Here is the price position in relation to pivot points:
| Pivot points | S3 | S2 | S1 | PP | R1 | R2 | R3 |
|---|---|---|---|---|---|---|---|
| Standard | 454.74 | 470.88 | 486.74 | 502.88 | 518.74 | 534.88 | 550.74 |
| Camarilla | 493.81 | 496.74 | 499.68 | 502.61 | 505.54 | 508.48 | 511.41 |
| Woodie | 454.61 | 470.81 | 486.61 | 502.81 | 518.61 | 534.81 | 550.61 |
| Fibonacci | 470.88 | 483.10 | 490.65 | 502.88 | 515.10 | 522.65 | 534.88 |
| Pivot points | S3 | S2 | S1 | PP | R1 | R2 | R3 |
|---|---|---|---|---|---|---|---|
| Standard | 473.58 | 502.87 | 561.45 | 590.74 | 649.32 | 678.61 | 737.19 |
| Camarilla | 595.87 | 603.92 | 611.98 | 620.03 | 628.09 | 636.14 | 644.19 |
| Woodie | 488.23 | 510.19 | 576.10 | 598.06 | 663.97 | 685.93 | 751.84 |
| Fibonacci | 502.87 | 536.44 | 557.17 | 590.74 | 624.31 | 645.04 | 678.61 |
| Pivot points | S3 | S2 | S1 | PP | R1 | R2 | R3 |
|---|---|---|---|---|---|---|---|
| Standard | 250.63 | 379.09 | 470.07 | 598.53 | 689.51 | 817.97 | 908.95 |
| Camarilla | 500.69 | 520.81 | 540.93 | 561.04 | 581.16 | 601.27 | 621.39 |
| Woodie | 231.88 | 369.72 | 451.32 | 589.16 | 670.76 | 808.60 | 890.20 |
| Fibonacci | 379.09 | 462.92 | 514.71 | 598.53 | 682.36 | 734.15 | 817.97 |
Numerical data
The following are the details of the technical indicators and moving averages that were collected to generate this technical analysis:
| RSI (14): | 44.79 | |
| MACD (12,26,9): | -12.4200 | |
| Directional Movement: | -6.68 | |
| AROON (14): | -92.86 | |
| DEMA (21): | 554.10 | |
| Parabolic SAR (0,02-0,02-0,2): | 617.37 | |
| Elder Ray (13): | -38.32 | |
| Super Trend (3,10): | 634.68 | |
| Zig ZAG (10): | 531.62 | |
| VORTEX (21): | 0.8700 | |
| Stochastique (14,3,5): | 15.50 | |
| TEMA (21): | 532.15 | |
| Williams %R (14): | -66.46 | |
| Chande Momentum Oscillator (20): | -31.07 | |
| Repulse (5,40,3): | -3.5600 | |
| ROCnROLL: | 2 | |
| TRIX (15,9): | -0.1100 | |
| Courbe Coppock: | 21.13 |
| MA7: | 550.30 | |
| MA20: | 577.85 | |
| MA50: | 566.05 | |
| MA100: | 524.36 | |
| MAexp7: | 543.96 | |
| MAexp20: | 565.27 | |
| MAexp50: | 561.19 | |
| MAexp100: | 546.20 | |
| Price / MA7: | -3.39% | |
| Price / MA20: | -8.00% | |
| Price / MA50: | -6.08% | |
| Price / MA100: | +1.38% | |
| Price / MAexp7: | -2.27% | |
| Price / MAexp20: | -5.95% | |
| Price / MAexp50: | -5.27% | |
| Price / MAexp100: | -2.67% |
About author

Online


Add a comment
Comments
0 comments on the analysis MAKER - MKR/USD - Daily