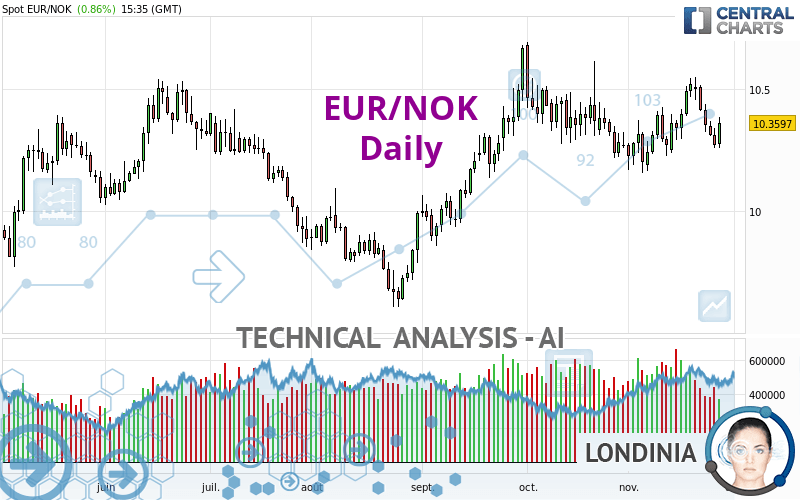
EUR/NOK - Daily - Technical analysis published on 11/28/2022 (GMT)
- 149
- 0
Click here for a new analysis!
- Timeframe : Daily
- - Analysis generated on
- Status : TARGET REACHED

Summary of the analysis

Additional analysis
Quotes
The EUR/NOK rating is 10.3598 NOK. The price registered an increase of +0.87% on the session and was traded between 10.2589 NOK and 10.3871 NOK over the period. The price is currently at +0.98% from its lowest and -0.26% from its highest.The Central Gaps scanner detects a bullish opening marking the presence of buyers ahead of sellers at the opening but not sufficiently marked to allow the price to register a quotation gap.
Bullish opening
Type : Bullish
Timeframe : Openning
So that you have an overall view of the price change, here is a table showing the variations over several periods:
Near a new HIGH record (1 year)
Type : Bullish
Timeframe : Weekly
Near a new HIGH record (1st january)
Type : Bullish
Timeframe : Weekly
Near a new HIGH record (1 month)
Type : Bullish
Timeframe : Weekly
Technical
Technical analysis of EUR/NOK in Daily shows a strongly overall bullish trend. 82.14% of the signals given by moving averages are bullish. The slightly bullish signals given by the short-term moving averages indicate this trend is showing signs of running out of steam. An assessment of moving averages reveals several bullish signals that could impact this trend:
Bullish price crossover with Moving Average 20
Type : Bullish
Timeframe : Daily
Bullish price crossover with adaptative moving average 20
Type : Bullish
Timeframe : Daily
On the 18 technical indicators analysed, 5 are bullish, 10 are neutral and 3 are bearish. But beware of excesses. The Central Indicators scanner currently detects this:
RSI indicator: bullish divergence
Type : Bullish
Timeframe : Daily
Pivot points : price is over resistance 1
Type : Neutral
Timeframe : Daily
RSI indicator is back over 50
Type : Bullish
Timeframe : Daily
Price is back over the pivot point
Type : Bullish
Timeframe : Weekly
Momentum indicator is back over 0
Type : Bullish
Timeframe : Daily
The analysis of the price chart with Central Patterns scanners does not return any result.
No result was found by the Central Candlesticks scanner on Japanese candlesticks.
| S3 | S2 | S1 | Price | R1 | R2 | R3 | |
|---|---|---|---|---|---|---|---|
| ProTrendLines | 9.8924 | 9.9924 | 10.1990 | 10.3598 | 10.3951 | 10.5049 | 10.6694 |
| Change (%) | -4.51% | -3.55% | -1.55% | - | +0.34% | +1.40% | +2.99% |
| Change | -0.4674 | -0.3674 | -0.1608 | - | +0.0353 | +0.1451 | +0.3096 |
| Level | Minor | Major | Intermediate | - | Major | Intermediate | Major |
To determine price objectives, it is also possible to use the pivot points. Here is the price position in relation to pivot points:
| Pivot points | S3 | S2 | S1 | PP | R1 | R2 | R3 |
|---|---|---|---|---|---|---|---|
| Standard | 10.1580 | 10.2080 | 10.2395 | 10.2895 | 10.3210 | 10.3710 | 10.4025 |
| Camarilla | 10.2486 | 10.2561 | 10.2635 | 10.2710 | 10.2785 | 10.2859 | 10.2934 |
| Woodie | 10.1488 | 10.2034 | 10.2303 | 10.2849 | 10.3118 | 10.3664 | 10.3933 |
| Fibonacci | 10.2080 | 10.2391 | 10.2584 | 10.2895 | 10.3206 | 10.3399 | 10.3710 |
| Pivot points | S3 | S2 | S1 | PP | R1 | R2 | R3 |
|---|---|---|---|---|---|---|---|
| Standard | 9.8757 | 10.0669 | 10.1689 | 10.3601 | 10.4621 | 10.6533 | 10.7553 |
| Camarilla | 10.1904 | 10.2173 | 10.2441 | 10.2710 | 10.2979 | 10.3248 | 10.3516 |
| Woodie | 9.8312 | 10.0446 | 10.1244 | 10.3378 | 10.4176 | 10.6310 | 10.7108 |
| Fibonacci | 10.0669 | 10.1789 | 10.2481 | 10.3601 | 10.4721 | 10.5413 | 10.6533 |
| Pivot points | S3 | S2 | S1 | PP | R1 | R2 | R3 |
|---|---|---|---|---|---|---|---|
| Standard | 9.6221 | 9.9210 | 10.0959 | 10.3948 | 10.5697 | 10.8686 | 11.0435 |
| Camarilla | 10.1406 | 10.1840 | 10.2275 | 10.2709 | 10.3143 | 10.3578 | 10.4012 |
| Woodie | 9.5602 | 9.8900 | 10.0340 | 10.3638 | 10.5078 | 10.8376 | 10.9816 |
| Fibonacci | 9.9210 | 10.1020 | 10.2138 | 10.3948 | 10.5758 | 10.6876 | 10.8686 |
Numerical data
The following is the status of technical indicators and moving averages registered at the time this technical analysis was created:
| RSI (14): | 50.94 | |
| MACD (12,26,9): | 0.0121 | |
| Directional Movement: | 2.7510 | |
| AROON (14): | 42.8571 | |
| DEMA (21): | 10.3771 | |
| Parabolic SAR (0,02-0,02-0,2): | 10.5453 | |
| Elder Ray (13): | -0.0405 | |
| Super Trend (3,10): | 10.1686 | |
| Zig ZAG (10): | 10.3620 | |
| VORTEX (21): | 1.0154 | |
| Stochastique (14,3,5): | 31.28 | |
| TEMA (21): | 10.3642 | |
| Williams %R (14): | -58.88 | |
| Chande Momentum Oscillator (20): | 0.0641 | |
| Repulse (5,40,3): | 0.0154 | |
| ROCnROLL: | -1 | |
| TRIX (15,9): | 0.0226 | |
| Courbe Coppock: | 1.91 |
| MA7: | 10.3913 | |
| MA20: | 10.3438 | |
| MA50: | 10.3639 | |
| MA100: | 10.1681 | |
| MAexp7: | 10.3585 | |
| MAexp20: | 10.3589 | |
| MAexp50: | 10.3111 | |
| MAexp100: | 10.2378 | |
| Price / MA7: | -0.30% | |
| Price / MA20: | +0.15% | |
| Price / MA50: | -0.04% | |
| Price / MA100: | +1.89% | |
| Price / MAexp7: | +0.01% | |
| Price / MAexp20: | +0.01% | |
| Price / MAexp50: | +0.47% | |
| Price / MAexp100: | +1.19% |
About author
Online


Add a comment
Comments
0 comments on the analysis EUR/NOK - Daily