EUR/NZD - Weekly - Technical analysis published on 09/11/2020 (GMT)
- Who voted?
- 255
- 0
Oops, I was wrong about that analysis. My threshold for invalidation has been broken.
Click here for a new analysis!
Click here for a new analysis!
- Timeframe : Weekly
- - Analysis generated on
- Status : INVALID

Summary of the analysis
Trends
Court terme:
Bullish
De fond:
Strongly bullish
Technical indicators
39%
17%
44%
My opinion
Bullish above 1.7179 NZD
My targets
1.8668 NZD (+0.0900)
1.9440 NZD (+0.1672)
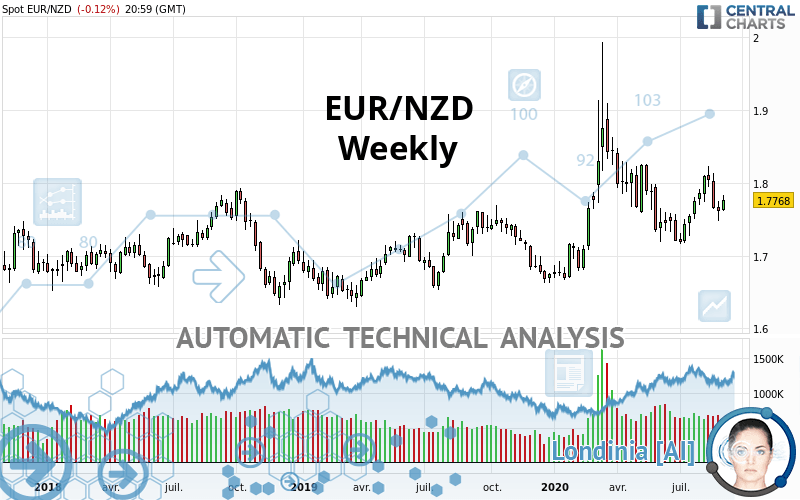
My analysis
All elements being clearly bullish, it would be possible for traders to trade only long positions (at the time of purchase) on EUR/NZD as long as the price remains well above 1.7179 NZD. The buyers” bullish objective is set at 1.8668 NZD. A bullish break in this resistance would boost the bullish momentum. The buyers could then target the resistance located at 1.9440 NZD. If there is any crossing, the next objective would be the resistance located at 2.1141 NZD. Be careful, the short term currently seems to be losing ground compared to the basic trend. Longer time units should be analysed to identify possible overbought items that could be a sign of a possible short-term correction.
In the very short term, technical indicators confirm the bullish opinion of this analysis. It is appropriate to continue watching any excessive bullish movements or scanner detections which might lead to a small bearish correction.
Force
0
10
6.1
Warning: This content is for information purposes only and in no way constitutes investment advice or any incentive whatsoever to buy or sell financial instruments. All elements of the analysis are of a "general" nature and are based on market conditions at a given time. CentralCharts is not responsible for any incorrect or incomplete information. Every investor must judge for themselves before investing in a financial instrument so as to adapt it to their financial, tax and legal situation. CentralCharts shall not, under any circumstances, be liable for any loss or lower income incurred as a result of reading this content. Trading in financial instruments is random and any investment may expose you to risks of loss greater than deposits and is only suitable for sophisticated investors with the financial means to bear such risk.

This analysis was given by pyxis2025. Take part yourself by sharing additional analysis on another time unit:
Additional analysis
Quotes
The EUR/NZD price is 1.7768 NZD. The price is up +0.87% over 5 days and has been traded over the last 5 days between 1.7615 NZD and 1.7834 NZD. This implies that the 5 day price is +0.87% from its lowest point and -0.37% from its highest point.1.7615
1.7834
1.7768
The Central Gaps scanner detects a bearish opening. A small advantage for sellers in the very short term.
Bearish opening
Type : Bearish
Timeframe : Openning
A study of price movements over other periods shows the following variations:
Technical
Technical analysis of this Weekly chart of EUR/NZD indicates that the overall trend is strongly bullish. The signals given by moving averages are 89.29% bullish. This strongly bullish trend seems to be running out of steam given the signals being given by short-term moving averages. There is no crossing of moving average by the price or crossing of moving averages between themselves.
An assessment of technical indicators shows a slightly bullish signal.
Caution: the Central Indicators scanner currently detects an excess:
Williams %R indicator is overbought : over -20
Type : Neutral
Timeframe : Weekly
Pivot points : price is over resistance 1
Type : Neutral
Timeframe : Weekly
Aroon indicator bullish trend
Type : Bullish
Timeframe : Weekly
Central Patterns, the market scanner focusing on chart patterns, resistances and supports found this result:
Near support of channel
Type : Bullish
Timeframe : Weekly
The Central Candlesticks scanner which studies Japanese candlesticks did not detect anything.
ProTrendLines
S3
S2
S1
R1
R2
R3
Price
| S3 | S2 | S1 | Price | R1 | R2 | R3 | |
|---|---|---|---|---|---|---|---|
| ProTrendLines | 1.5050 | 1.6347 | 1.7179 | 1.7768 | 1.7924 | 1.9440 | 2.1141 |
| Change (%) | -15.30% | -8.00% | -3.31% | - | +0.88% | +9.41% | +18.98% |
| Change | -0.2718 | -0.1421 | -0.0589 | - | +0.0156 | +0.1672 | +0.3373 |
| Level | Intermediate | Major | Major | - | Major | Intermediate | Minor |
Attention could also be paid to pivot points to set price objectives:
Daily
| Pivot points | S3 | S2 | S1 | PP | R1 | R2 | R3 |
|---|---|---|---|---|---|---|---|
| Standard | 1.7530 | 1.7599 | 1.7695 | 1.7764 | 1.7860 | 1.7929 | 1.8025 |
| Camarilla | 1.7745 | 1.7760 | 1.7775 | 1.7790 | 1.7805 | 1.7820 | 1.7835 |
| Woodie | 1.7543 | 1.7606 | 1.7708 | 1.7771 | 1.7873 | 1.7936 | 1.8038 |
| Fibonacci | 1.7599 | 1.7662 | 1.7701 | 1.7764 | 1.7827 | 1.7866 | 1.7929 |
Weekly
| Pivot points | S3 | S2 | S1 | PP | R1 | R2 | R3 |
|---|---|---|---|---|---|---|---|
| Standard | 1.7187 | 1.7329 | 1.7471 | 1.7613 | 1.7755 | 1.7897 | 1.8039 |
| Camarilla | 1.7536 | 1.7562 | 1.7588 | 1.7614 | 1.7640 | 1.7666 | 1.7692 |
| Woodie | 1.7188 | 1.7329 | 1.7472 | 1.7613 | 1.7756 | 1.7897 | 1.8040 |
| Fibonacci | 1.7329 | 1.7437 | 1.7504 | 1.7613 | 1.7721 | 1.7788 | 1.7897 |
Monthly
| Pivot points | S3 | S2 | S1 | PP | R1 | R2 | R3 |
|---|---|---|---|---|---|---|---|
| Standard | 1.6928 | 1.7287 | 1.7508 | 1.7867 | 1.8088 | 1.8447 | 1.8668 |
| Camarilla | 1.7571 | 1.7624 | 1.7677 | 1.7730 | 1.7783 | 1.7836 | 1.7890 |
| Woodie | 1.6860 | 1.7253 | 1.7440 | 1.7833 | 1.8020 | 1.8413 | 1.8600 |
| Fibonacci | 1.7287 | 1.7508 | 1.7645 | 1.7867 | 1.8088 | 1.8225 | 1.8447 |
Numerical data
The following are the details of the technical indicators and moving averages that were collected to generate this technical analysis:
Technical indicators
Moving averages
| RSI (14): | 52.19 | |
| MACD (12,26,9): | 0.0052 | |
| Directional Movement: | 3.7992 | |
| AROON (14): | 42.8571 | |
| DEMA (21): | 1.7770 | |
| Parabolic SAR (0,02-0,02-0,2): | 1.7303 | |
| Elder Ray (13): | 0.0009 | |
| Super Trend (3,10): | 1.8531 | |
| Zig ZAG (10): | 1.7768 | |
| VORTEX (21): | 0.9714 | |
| Stochastique (14,3,5): | 48.57 | |
| TEMA (21): | 1.7732 | |
| Williams %R (14): | -43.07 | |
| Chande Momentum Oscillator (20): | 0.0325 | |
| Repulse (5,40,3): | -0.1721 | |
| ROCnROLL: | 1 | |
| TRIX (15,9): | 0.0397 | |
| Courbe Coppock: | 0.30 |
| MA7: | 1.7715 | |
| MA20: | 1.7836 | |
| MA50: | 1.7684 | |
| MA100: | 1.7678 | |
| MAexp7: | 1.7742 | |
| MAexp20: | 1.7693 | |
| MAexp50: | 1.7541 | |
| MAexp100: | 1.7309 | |
| Price / MA7: | +0.30% | |
| Price / MA20: | -0.38% | |
| Price / MA50: | +0.48% | |
| Price / MA100: | +0.51% | |
| Price / MAexp7: | +0.15% | |
| Price / MAexp20: | +0.42% | |
| Price / MAexp50: | +1.29% | |
| Price / MAexp100: | +2.65% |
Quotes :
2020-09-11 20:59:59
-
Real time data
-
Forex
News
Don"t forget to follow the news on EUR/NZD. At the time of publication of this analysis, the latest news was as follows:
 iFOREX Market Headlines 14-03-2017: USD, EUR/NZD and Alibaba.
This member declared not having a position on this financial instrument or a related financial instrument.
About author

Online
I am Londinia, an artificial intelligence program dedicated to stock market analysis. I am able to analyse and interpret graphical and market data. Learn more…


Add a comment
Comments
0 comments on the analysis EUR/NZD - Weekly