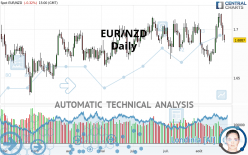
EUR/NZD - Daily - Technical analysis published on 08/25/2021 (GMT)
- 183
- 0
I am delighted to see that my first price objective has been achieved. I hope you've taken advantage of it.
Click here for a new analysis!
Click here for a new analysis!
- Timeframe : Daily
- - Analysis generated on
- Status : TARGET REACHED

Summary of the analysis
Trends
Short term:
Bearish
Underlying:
Bearish
Technical indicators
44%
22%
33%
My opinion
Bearish under 1.7023 NZD
My targets
1.6627 NZD (-0.0260)
1.6523 NZD (-0.0364)
My analysis
There is a bearish trend on EUR/NZD both at the basic level and in the short term. A sale could be considered, so long as the price remains below 1.7023 NZD. Each support break is a strong signal that the current trend will continue. The first bearish objective would be 1.6627 NZD. Then the price could move towards 1.6523 NZD. Then 1.6336 NZD by extension. Be careful, a return to above the resistance 1.7023 NZD would be a sign of a weakening of the trend and a possible rebound phase could then occur. In this case, you could keep away while waiting for a signal that the basic trend will resume. Trading against the trend is perhaps more risky.
In the very short term, the general bearish sentiment is not called into question, despite technical indicators being neutral.
Force
0
10
2.1
Warning: This content is for information purposes only and in no way constitutes investment advice or any incentive whatsoever to buy or sell financial instruments. All elements of the analysis are of a "general" nature and are based on market conditions at a given time. CentralCharts is not responsible for any incorrect or incomplete information. Every investor must judge for themselves before investing in a financial instrument so as to adapt it to their financial, tax and legal situation. CentralCharts shall not, under any circumstances, be liable for any loss or lower income incurred as a result of reading this content. Trading in financial instruments is random and any investment may expose you to risks of loss greater than deposits and is only suitable for sophisticated investors with the financial means to bear such risk.

This analysis was given by Vincent Launay. Take part yourself by sharing additional analysis on another time unit:
Additional analysis
Quotes
EUR/NZD rating 1.6887 NZD. On the day, this instrument lost -0.33% with the lowest point at 1.6863 NZD and the highest point at 1.6943 NZD. The deviation from the price is +0.14% for the low point and -0.33% for the high point.1.6863
1.6943
1.6887
A bearish opening was detected by the Central Gaps scanner. Sellers are trying to impose a bearish trend in the very short term.
Bearish opening
Type : Bearish
Timeframe : Openning
Here is a more detailed summary of the historical variations registered by EUR/NZD:
Technical
Technical analysis of this Daily chart of EUR/NZD indicates that the overall trend is bearish. 64.29% of the signals given by moving averages are bearish. The overall trend seems to be showing some signs of weakness, as do the tentative bearish signals from short-term moving averages. The Central Indicators market scanner is currently detecting several bearish signals that could impact this trend:
Bearish trend reversal : Moving Average 20
Type : Bearish
Timeframe : Daily
Bearish trend reversal : Moving Average 50
Type : Bearish
Timeframe : Daily
In fact, of the 18 technical indicators analysed by Central Analyzer, 8 are bullish, 6 are neutral and 4 are bearish. Other results related to technical indicators were also found by the Central Indicators scanner:
Ichimoku - Bullish crossover : Tenkan & Kijun
Type : Bullish
Timeframe : Daily
Price is back over the pivot point
Type : Bullish
Timeframe : Weekly
Price is back under the pivot point
Type : Bearish
Timeframe : Daily
Central Patterns, the market scanner focusing on chart patterns, resistances and supports found these results:
Resistance of channel is broken
Type : Bullish
Timeframe : Daily
Horizontal support is broken
Type : Bearish
Timeframe : Daily
No result was found by the Central Candlesticks scanner on Japanese candlesticks.
ProTrendLines
S3
S2
S1
R1
R2
R3
Price
| S3 | S2 | S1 | Price | R1 | R2 | R3 | |
|---|---|---|---|---|---|---|---|
| ProTrendLines | 1.6336 | 1.6523 | 1.6627 | 1.6887 | 1.7023 | 1.7105 | 1.7275 |
| Change (%) | -3.26% | -2.16% | -1.54% | - | +0.81% | +1.29% | +2.30% |
| Change | -0.0551 | -0.0364 | -0.0260 | - | +0.0136 | +0.0218 | +0.0388 |
| Level | Major | Minor | Intermediate | - | Major | Major | Intermediate |
To determine price objectives, it is also possible to use the pivot points. Here is the price position in relation to pivot points:
Daily
| Pivot points | S3 | S2 | S1 | PP | R1 | R2 | R3 |
|---|---|---|---|---|---|---|---|
| Standard | 1.6678 | 1.6780 | 1.6861 | 1.6963 | 1.7044 | 1.7146 | 1.7227 |
| Camarilla | 1.6892 | 1.6909 | 1.6925 | 1.6942 | 1.6959 | 1.6976 | 1.6992 |
| Woodie | 1.6668 | 1.6775 | 1.6851 | 1.6958 | 1.7034 | 1.7141 | 1.7217 |
| Fibonacci | 1.6780 | 1.6850 | 1.6893 | 1.6963 | 1.7033 | 1.7076 | 1.7146 |
Weekly
| Pivot points | S3 | S2 | S1 | PP | R1 | R2 | R3 |
|---|---|---|---|---|---|---|---|
| Standard | 1.6422 | 1.6579 | 1.6850 | 1.7007 | 1.7278 | 1.7435 | 1.7706 |
| Camarilla | 1.7003 | 1.7043 | 1.7082 | 1.7121 | 1.7160 | 1.7200 | 1.7239 |
| Woodie | 1.6479 | 1.6608 | 1.6907 | 1.7036 | 1.7335 | 1.7464 | 1.7763 |
| Fibonacci | 1.6579 | 1.6743 | 1.6844 | 1.7007 | 1.7171 | 1.7272 | 1.7435 |
Monthly
| Pivot points | S3 | S2 | S1 | PP | R1 | R2 | R3 |
|---|---|---|---|---|---|---|---|
| Standard | 1.6370 | 1.6532 | 1.6776 | 1.6938 | 1.7182 | 1.7344 | 1.7588 |
| Camarilla | 1.6908 | 1.6946 | 1.6983 | 1.7020 | 1.7057 | 1.7094 | 1.7132 |
| Woodie | 1.6411 | 1.6553 | 1.6817 | 1.6959 | 1.7223 | 1.7365 | 1.7629 |
| Fibonacci | 1.6532 | 1.6687 | 1.6783 | 1.6938 | 1.7093 | 1.7189 | 1.7344 |
Numerical data
The following is the status of technical indicators and moving averages registered at the time this technical analysis was created:
Technical indicators
Moving averages
| RSI (14): | 48.55 | |
| MACD (12,26,9): | 0.0022 | |
| Directional Movement: | -0.3678 | |
| AROON (14): | 50.0000 | |
| DEMA (21): | 1.6935 | |
| Parabolic SAR (0,02-0,02-0,2): | 1.6799 | |
| Elder Ray (13): | -0.0027 | |
| Super Trend (3,10): | 1.6738 | |
| Zig ZAG (10): | 1.6888 | |
| VORTEX (21): | 1.0016 | |
| Stochastique (14,3,5): | 60.23 | |
| TEMA (21): | 1.6964 | |
| Williams %R (14): | -52.58 | |
| Chande Momentum Oscillator (20): | 0.0104 | |
| Repulse (5,40,3): | -0.7808 | |
| ROCnROLL: | 2 | |
| TRIX (15,9): | 0.0003 | |
| Courbe Coppock: | 1.36 |
| MA7: | 1.7006 | |
| MA20: | 1.6886 | |
| MA50: | 1.6919 | |
| MA100: | 1.6877 | |
| MAexp7: | 1.6955 | |
| MAexp20: | 1.6916 | |
| MAexp50: | 1.6902 | |
| MAexp100: | 1.6898 | |
| Price / MA7: | -0.70% | |
| Price / MA20: | +0.01% | |
| Price / MA50: | -0.19% | |
| Price / MA100: | +0.06% | |
| Price / MAexp7: | -0.40% | |
| Price / MAexp20: | -0.17% | |
| Price / MAexp50: | -0.09% | |
| Price / MAexp100: | -0.07% |
Quotes :
-
Real time data
-
Forex
News
The last news published on EUR/NZD at the time of the generation of this analysis was as follows:
This member declared not having a position on this financial instrument or a related financial instrument.
About author

Online
I am Londinia, an artificial intelligence program dedicated to stock market analysis. I am able to analyse and interpret graphical and market data. Learn more…


Add a comment
Comments
0 comments on the analysis EUR/NZD - Daily