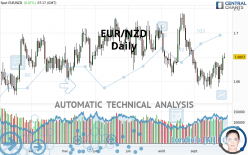
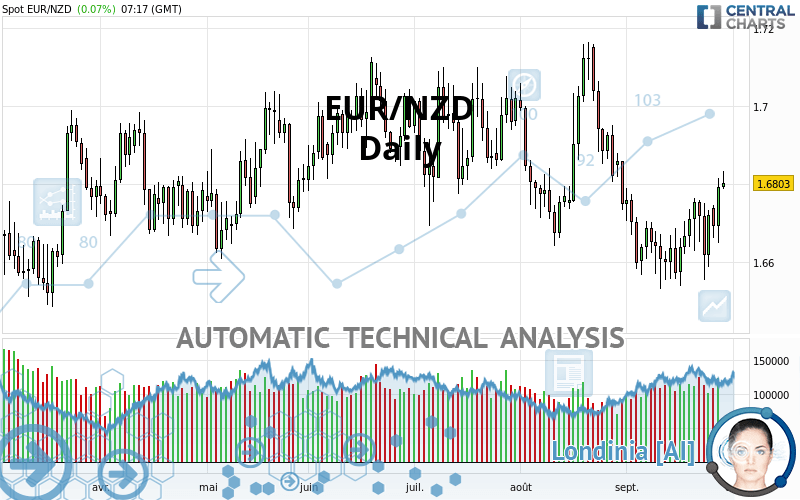
EUR/NZD - Daily - Technical analysis published on 09/29/2021 (GMT)
- 350
- 0
Click here for a new analysis!
- Timeframe : Daily
- - Analysis generated on
- Status : INVALID
Summary of the analysis

Additional analysis
Quotes
The EUR/NZD rating is 1.6803 NZD. On the day, this instrument gained +0.07% and was between 1.6789 NZD and 1.6834 NZD. This implies that the price is at +0.08% from its lowest and at -0.18% from its highest.Here is a more detailed summary of the historical variations registered by EUR/NZD:
Technical
Technical analysis of EUR/NZD in Daily shows an overall slightly bearish trend. 57.14% of the signals given by moving averages are bearish. Caution: the strong bullish signals currently being given by short-term moving averages could quickly lead to a reversal of the trend. An assessment of moving averages reveals several bullish signals that could impact this trend:
Bullish trend reversal : Moving Average 20
Type : Bullish
Timeframe : Daily
Bullish trend reversal : adaptative moving average 50
Type : Bullish
Timeframe : Daily
Bullish price crossover with adaptative moving average 20
Type : Bullish
Timeframe : Daily
Bullish price crossover with adaptative moving average 100
Type : Bullish
Timeframe : Daily
The probability of a further increase is high given the direction of the technical indicators.
But beware of excesses. The Central Indicators scanner currently detects this:
CCI indicator is overbought : over 100
Type : Neutral
Timeframe : Daily
Williams %R indicator is overbought : over -20
Type : Neutral
Timeframe : Daily
RSI indicator is back over 50
Type : Bullish
Timeframe : Daily
Parabolic SAR indicator bullish reversal
Type : Bullish
Timeframe : Daily
Price is back over the pivot point
Type : Bullish
Timeframe : Daily
Price is back over the pivot point
Type : Bullish
Timeframe : Weekly
The Central Patterns scanner, which studies chart patterns, resistances and supports, has identified these signals:
Near horizontal resistance
Type : Bearish
Timeframe : Daily
Resistance of channel is broken
Type : Bullish
Timeframe : Daily
The Central Candlesticks scanner which studies Japanese candlesticks did not detect anything.
| S3 | S2 | S1 | Price | R1 | R2 | R3 | |
|---|---|---|---|---|---|---|---|
| ProTrendLines | 1.5050 | 1.6336 | 1.6627 | 1.6803 | 1.6814 | 1.6948 | 1.7023 |
| Change (%) | -10.43% | -2.78% | -1.05% | - | +0.07% | +0.86% | +1.31% |
| Change | -0.1753 | -0.0467 | -0.0176 | - | +0.0011 | +0.0145 | +0.0220 |
| Level | Minor | Major | Major | - | Intermediate | Intermediate | Minor |
Pivot points can also be used to set your price objectives. Here is the price situation in relation to pivot points:
| Pivot points | S3 | S2 | S1 | PP | R1 | R2 | R3 |
|---|---|---|---|---|---|---|---|
| Standard | 1.6522 | 1.6586 | 1.6689 | 1.6753 | 1.6856 | 1.6920 | 1.7023 |
| Camarilla | 1.6746 | 1.6761 | 1.6777 | 1.6792 | 1.6807 | 1.6823 | 1.6838 |
| Woodie | 1.6542 | 1.6596 | 1.6709 | 1.6763 | 1.6876 | 1.6930 | 1.7043 |
| Fibonacci | 1.6586 | 1.6650 | 1.6689 | 1.6753 | 1.6817 | 1.6856 | 1.6920 |
| Pivot points | S3 | S2 | S1 | PP | R1 | R2 | R3 |
|---|---|---|---|---|---|---|---|
| Standard | 1.6386 | 1.6470 | 1.6596 | 1.6680 | 1.6806 | 1.6890 | 1.7016 |
| Camarilla | 1.6664 | 1.6684 | 1.6703 | 1.6722 | 1.6741 | 1.6761 | 1.6780 |
| Woodie | 1.6407 | 1.6481 | 1.6617 | 1.6691 | 1.6827 | 1.6901 | 1.7037 |
| Fibonacci | 1.6470 | 1.6550 | 1.6600 | 1.6680 | 1.6760 | 1.6810 | 1.6890 |
| Pivot points | S3 | S2 | S1 | PP | R1 | R2 | R3 |
|---|---|---|---|---|---|---|---|
| Standard | 1.6016 | 1.6328 | 1.6539 | 1.6851 | 1.7062 | 1.7374 | 1.7585 |
| Camarilla | 1.6605 | 1.6653 | 1.6701 | 1.6749 | 1.6797 | 1.6845 | 1.6893 |
| Woodie | 1.5965 | 1.6303 | 1.6488 | 1.6826 | 1.7011 | 1.7349 | 1.7534 |
| Fibonacci | 1.6328 | 1.6528 | 1.6652 | 1.6851 | 1.7051 | 1.7175 | 1.7374 |
Numerical data
The following are the details of the technical indicators and moving averages that were collected to generate this technical analysis:
| RSI (14): | 55.10 | |
| MACD (12,26,9): | -0.0014 | |
| Directional Movement: | 0.6965 | |
| AROON (14): | 92.8571 | |
| DEMA (21): | 1.6691 | |
| Parabolic SAR (0,02-0,02-0,2): | 1.6559 | |
| Elder Ray (13): | 0.0095 | |
| Super Trend (3,10): | 1.6915 | |
| Zig ZAG (10): | 1.6801 | |
| VORTEX (21): | 1.0231 | |
| Stochastique (14,3,5): | 83.53 | |
| TEMA (21): | 1.6716 | |
| Williams %R (14): | -8.61 | |
| Chande Momentum Oscillator (20): | 0.0206 | |
| Repulse (5,40,3): | 0.7031 | |
| ROCnROLL: | 1 | |
| TRIX (15,9): | -0.0357 | |
| Courbe Coppock: | 0.90 |
| MA7: | 1.6729 | |
| MA20: | 1.6673 | |
| MA50: | 1.6798 | |
| MA100: | 1.6860 | |
| MAexp7: | 1.6735 | |
| MAexp20: | 1.6722 | |
| MAexp50: | 1.6775 | |
| MAexp100: | 1.6822 | |
| Price / MA7: | +0.44% | |
| Price / MA20: | +0.78% | |
| Price / MA50: | +0.03% | |
| Price / MA100: | -0.34% | |
| Price / MAexp7: | +0.41% | |
| Price / MAexp20: | +0.48% | |
| Price / MAexp50: | +0.17% | |
| Price / MAexp100: | -0.11% |
News
Don't forget to follow the news on EUR/NZD. At the time of publication of this analysis, the latest news was as follows:
About author

Online


Add a comment
Comments
0 comments on the analysis EUR/NZD - Daily