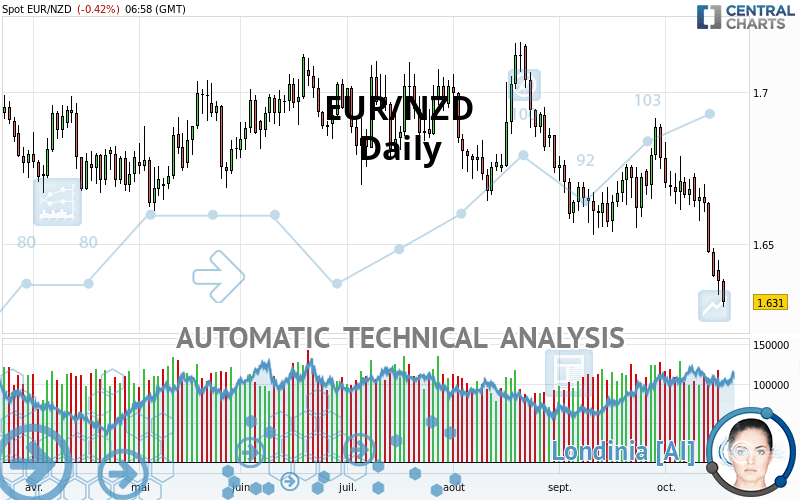
EUR/NZD - Daily - Technical analysis published on 10/19/2021 (GMT)
- 537
- 0
Click here for a new analysis!
- Timeframe : Daily
- - Analysis generated on
- Status : TARGET REACHED

Summary of the analysis

Additional analysis
Quotes
The EUR/NZD rating is 1.6309 NZD. On the day, this instrument lost -0.43% and was traded between 1.6294 NZD and 1.6387 NZD over the period. The price is currently at +0.09% from its lowest and -0.48% from its highest.A study of price movements over other periods shows the following variations:
New LOW record (1 year)
Type : Bearish
Timeframe : Weekly
Near a new HIGH record (1st january)
Type : Bullish
Timeframe : Weekly
New LOW record (1st january)
Type : Bearish
Timeframe : Weekly
Near a new HIGH record (1 month)
Type : Bullish
Timeframe : Weekly
New LOW record (1 month)
Type : Bearish
Timeframe : Weekly
Technical
A technical analysis in Daily of this EUR/NZD chart shows a sharp bearish trend. The signals given by moving averages are 92.86% bearish. This strong bearish trend is confirmed by the strong signals currently being given by short-term moving averages. The Central Indicators market scanner currently does not detect any result that concerns moving averages.
An assessment of technical indicators shows a strong bearish signal.
Caution: the Central Indicators scanner currently detects an excess:
CCI indicator is oversold : under -100
Type : Neutral
Timeframe : Daily
Previous candle closed under Bollinger bands
Type : Neutral
Timeframe : Daily
Williams %R indicator is oversold : under -80
Type : Neutral
Timeframe : Daily
Pivot points : price is under support 1
Type : Neutral
Timeframe : Daily
Price is back under the pivot point
Type : Bearish
Timeframe : Weekly
The Central Patterns scanner, which studies chart patterns, resistances and supports, has identified these signals:
Near horizontal support
Type : Bullish
Timeframe : Daily
Support of channel is broken
Type : Bearish
Timeframe : Daily
The Central Candlesticks scanner which studies Japanese candlesticks did not detect anything.
| S2 | S1 | Price | R1 | R2 | R3 | |
|---|---|---|---|---|---|---|
| ProTrendLines | 1.4001 | 1.5050 | 1.6309 | 1.6345 | 1.6626 | 1.6816 |
| Change (%) | -14.15% | -7.72% | - | +0.22% | +1.94% | +3.11% |
| Change | -0.2308 | -0.1259 | - | +0.0036 | +0.0317 | +0.0507 |
| Level | Minor | Minor | - | Major | Major | Minor |
To determine price objectives, it is also possible to use the pivot points. Here is the price position in relation to pivot points:
| Pivot points | S3 | S2 | S1 | PP | R1 | R2 | R3 |
|---|---|---|---|---|---|---|---|
| Standard | 1.6209 | 1.6270 | 1.6325 | 1.6386 | 1.6441 | 1.6502 | 1.6557 |
| Camarilla | 1.6347 | 1.6358 | 1.6368 | 1.6379 | 1.6390 | 1.6400 | 1.6411 |
| Woodie | 1.6205 | 1.6269 | 1.6321 | 1.6385 | 1.6437 | 1.6501 | 1.6553 |
| Fibonacci | 1.6270 | 1.6315 | 1.6342 | 1.6386 | 1.6431 | 1.6458 | 1.6502 |
| Pivot points | S3 | S2 | S1 | PP | R1 | R2 | R3 |
|---|---|---|---|---|---|---|---|
| Standard | 1.5936 | 1.6164 | 1.6279 | 1.6507 | 1.6622 | 1.6850 | 1.6965 |
| Camarilla | 1.6301 | 1.6332 | 1.6364 | 1.6395 | 1.6426 | 1.6458 | 1.6489 |
| Woodie | 1.5881 | 1.6136 | 1.6224 | 1.6479 | 1.6567 | 1.6822 | 1.6910 |
| Fibonacci | 1.6164 | 1.6295 | 1.6376 | 1.6507 | 1.6638 | 1.6719 | 1.6850 |
| Pivot points | S3 | S2 | S1 | PP | R1 | R2 | R3 |
|---|---|---|---|---|---|---|---|
| Standard | 1.6191 | 1.6361 | 1.6573 | 1.6743 | 1.6955 | 1.7125 | 1.7337 |
| Camarilla | 1.6679 | 1.6714 | 1.6749 | 1.6784 | 1.6819 | 1.6854 | 1.6889 |
| Woodie | 1.6211 | 1.6372 | 1.6593 | 1.6754 | 1.6975 | 1.7136 | 1.7357 |
| Fibonacci | 1.6361 | 1.6507 | 1.6597 | 1.6743 | 1.6889 | 1.6979 | 1.7125 |
Numerical data
The following is the status of the technical indicators and moving averages at the time of publication of this technical analysis:
| RSI (14): | 27.80 | |
| MACD (12,26,9): | -0.0087 | |
| Directional Movement: | -17.6249 | |
| AROON (14): | -100.0000 | |
| DEMA (21): | 1.6492 | |
| Parabolic SAR (0,02-0,02-0,2): | 1.6759 | |
| Elder Ray (13): | -0.0200 | |
| Super Trend (3,10): | 1.6685 | |
| Zig ZAG (10): | 1.6298 | |
| VORTEX (21): | 0.8672 | |
| Stochastique (14,3,5): | 3.00 | |
| TEMA (21): | 1.6439 | |
| Williams %R (14): | -100.00 | |
| Chande Momentum Oscillator (20): | -0.0405 | |
| Repulse (5,40,3): | -1.6212 | |
| ROCnROLL: | 2 | |
| TRIX (15,9): | -0.0379 | |
| Courbe Coppock: | 3.10 |
| MA7: | 1.6497 | |
| MA20: | 1.6641 | |
| MA50: | 1.6721 | |
| MA100: | 1.6824 | |
| MAexp7: | 1.6461 | |
| MAexp20: | 1.6591 | |
| MAexp50: | 1.6692 | |
| MAexp100: | 1.6765 | |
| Price / MA7: | -1.14% | |
| Price / MA20: | -2.00% | |
| Price / MA50: | -2.46% | |
| Price / MA100: | -3.06% | |
| Price / MAexp7: | -0.92% | |
| Price / MAexp20: | -1.69% | |
| Price / MAexp50: | -2.29% | |
| Price / MAexp100: | -2.71% |
News
The last news published on EUR/NZD at the time of the generation of this analysis was as follows:
About author

Online


Add a comment
Comments
0 comments on the analysis EUR/NZD - Daily