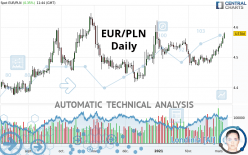
EUR/PLN - Daily - Technical analysis published on 03/05/2021 (GMT)
- 132
- 0
Click here for a new analysis!
- Timeframe : Daily
- - Analysis generated on
- Status : TARGET REACHED

Summary of the analysis

Additional analysis
Quotes
The EUR/PLN price is 4.5784 PLN. The price registered an increase of +0.35% on the session with the lowest point at 4.5609 PLN and the highest point at 4.5823 PLN. The deviation from the price is +0.38% for the low point and -0.09% for the high point.Here is a more detailed summary of the historical variations registered by EUR/PLN:
Near a new HIGH record (5 years)
Type : Bullish
Timeframe : Weekly
Near a new LOW record (1st january)
Type : Bearish
Timeframe : Weekly
Near a new LOW record (1 month)
Type : Bearish
Timeframe : Weekly
Technical
Technical analysis of EUR/PLN in Daily shows a strongly overall bullish trend. The signals given by the moving averages are 85.71% bullish. This strong bullish trend is confirmed by the strong signals currently being given by short-term moving averages. The Central Indicators market scanner is currently detecting a bullish signal that could impact this trend:
Moving Average bullish crossovers : AMA20 & AMA50
Type : Bullish
Timeframe : Daily
Technical indicators are strongly bullish, suggesting that the price increase should continue.
Caution: the Central Indicators scanner currently detects an excess:
CCI indicator is overbought : over 100
Type : Neutral
Timeframe : Daily
Williams %R indicator is overbought : over -20
Type : Neutral
Timeframe : Daily
Pivot points : price is over resistance 1
Type : Neutral
Timeframe : Daily
Pivot points : price is over resistance 2
Type : Neutral
Timeframe : Weekly
Ichimoku - Bullish crossover : Tenkan & Kijun
Type : Bullish
Timeframe : Daily
The Central Patterns scanner, which studies chart patterns, resistances and supports, has identified these signals:
Near resistance of triangle
Type : Bearish
Timeframe : Daily
Horizontal resistance is broken
Type : Bullish
Timeframe : Daily
Resistance of channel is broken
Type : Bullish
Timeframe : Daily
No result was found by the Central Candlesticks scanner on Japanese candlesticks.
| S3 | S2 | S1 | Price | R1 | R2 | R3 | |
|---|---|---|---|---|---|---|---|
| ProTrendLines | 4.4165 | 4.4967 | 4.5481 | 4.5784 | 4.5835 | 4.6319 | 4.9093 |
| Change (%) | -3.54% | -1.78% | -0.66% | - | +0.11% | +1.17% | +7.23% |
| Change | -0.1619 | -0.0817 | -0.0303 | - | +0.0051 | +0.0535 | +0.3309 |
| Level | Intermediate | Major | Major | - | Major | Intermediate | Intermediate |
Attention could also be paid to pivot points to set price objectives:
| Pivot points | S3 | S2 | S1 | PP | R1 | R2 | R3 |
|---|---|---|---|---|---|---|---|
| Standard | 4.5235 | 4.5339 | 4.5485 | 4.5589 | 4.5735 | 4.5839 | 4.5985 |
| Camarilla | 4.5562 | 4.5585 | 4.5608 | 4.5631 | 4.5654 | 4.5677 | 4.5700 |
| Woodie | 4.5256 | 4.5350 | 4.5506 | 4.5600 | 4.5756 | 4.5850 | 4.6006 |
| Fibonacci | 4.5339 | 4.5435 | 4.5494 | 4.5589 | 4.5685 | 4.5744 | 4.5839 |
| Pivot points | S3 | S2 | S1 | PP | R1 | R2 | R3 |
|---|---|---|---|---|---|---|---|
| Standard | 4.4457 | 4.4631 | 4.4925 | 4.5099 | 4.5393 | 4.5567 | 4.5861 |
| Camarilla | 4.5090 | 4.5133 | 4.5176 | 4.5219 | 4.5262 | 4.5305 | 4.5348 |
| Woodie | 4.4517 | 4.4661 | 4.4985 | 4.5129 | 4.5453 | 4.5597 | 4.5921 |
| Fibonacci | 4.4631 | 4.4810 | 4.4920 | 4.5099 | 4.5278 | 4.5388 | 4.5567 |
| Pivot points | S3 | S2 | S1 | PP | R1 | R2 | R3 |
|---|---|---|---|---|---|---|---|
| Standard | 4.4295 | 4.4502 | 4.4860 | 4.5067 | 4.5425 | 4.5632 | 4.5990 |
| Camarilla | 4.5064 | 4.5115 | 4.5167 | 4.5219 | 4.5271 | 4.5323 | 4.5374 |
| Woodie | 4.4372 | 4.4540 | 4.4937 | 4.5105 | 4.5502 | 4.5670 | 4.6067 |
| Fibonacci | 4.4502 | 4.4718 | 4.4851 | 4.5067 | 4.5283 | 4.5416 | 4.5632 |
Numerical data
The following is the status of the technical indicators and moving averages at the time of publication of this technical analysis:
| RSI (14): | 73.42 | |
| MACD (12,26,9): | 0.0131 | |
| Directional Movement: | 21.5612 | |
| AROON (14): | 78.5714 | |
| DEMA (21): | 4.5366 | |
| Parabolic SAR (0,02-0,02-0,2): | 4.5126 | |
| Elder Ray (13): | 0.0400 | |
| Super Trend (3,10): | 4.5099 | |
| Zig ZAG (10): | 4.5784 | |
| VORTEX (21): | 1.1916 | |
| Stochastique (14,3,5): | 92.58 | |
| TEMA (21): | 4.5484 | |
| Williams %R (14): | -5.88 | |
| Chande Momentum Oscillator (20): | 0.0846 | |
| Repulse (5,40,3): | 0.8904 | |
| ROCnROLL: | 1 | |
| TRIX (15,9): | 0.0083 | |
| Courbe Coppock: | 2.35 |
| MA7: | 4.5429 | |
| MA20: | 4.5101 | |
| MA50: | 4.5209 | |
| MA100: | 4.5120 | |
| MAexp7: | 4.5466 | |
| MAexp20: | 4.5238 | |
| MAexp50: | 4.5139 | |
| MAexp100: | 4.5049 | |
| Price / MA7: | +0.78% | |
| Price / MA20: | +1.51% | |
| Price / MA50: | +1.27% | |
| Price / MA100: | +1.47% | |
| Price / MAexp7: | +0.70% | |
| Price / MAexp20: | +1.21% | |
| Price / MAexp50: | +1.43% | |
| Price / MAexp100: | +1.63% |
News
The last news published on EUR/PLN at the time of the generation of this analysis was as follows:
-
 Where Is EUR/PLN Heading?
-
Volatility Expected For EUR/PLN
-
Poland: Political risks, and the EUR/PLN range-break
About author

Online


Add a comment
Comments
0 comments on the analysis EUR/PLN - Daily