PDD HOLDINGS INC. ADS - Daily - Technical analysis published on 11/25/2019 (GMT)
- Who voted?
- 356
- 0
Click here for a new analysis!
- Timeframe : Daily
- - Analysis generated on
- Status : INVALID

Summary of the analysis

Additional analysis
Quotes
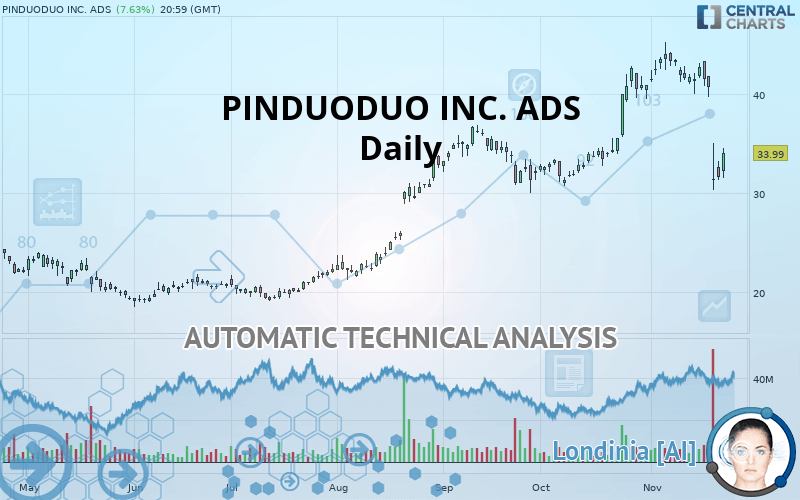
PINDUODUO INC. ADS rating 33.99 USD. The price has increased by +7.63% since the last closing and was traded between 31.52 USD and 34.57 USD over the period. The price is currently at +7.84% from its lowest and -1.68% from its highest.The Central Gaps scanner detects a bullish opening. A small advantage for buyers in the very short term.
Bullish opening
Type : Bullish
Timeframe : Openning
Here is a more detailed summary of the historical variations registered by PINDUODUO INC. ADS:
Near a new LOW record (1 month)
Type : Bearish
Timeframe : Weekly
The Central Volumes scanner detects abnormal volumes on the asset:
Abnormal volumes
Timeframe : 5 days
Technical
Technical analysis of this Daily chart of PINDUODUO INC. ADS indicates that the overall trend is not clearly defined. The trend could quickly turn bearish due to the strong bearish signals currently being given by short-term moving averages. There is no crossing of moving average by the price or crossing of moving averages between themselves.
Technical indicators are bearish. There is still some doubt about the decline in the price.
Caution: the Central Indicators scanner currently detects an excess:
RSI indicator is oversold : under 30
Type : Neutral
Timeframe : Daily
CCI indicator is oversold : under -100
Type : Neutral
Timeframe : Daily
Previous candle closed under Bollinger bands
Type : Neutral
Timeframe : Daily
Williams %R indicator is oversold : under -80
Type : Neutral
Timeframe : Daily
Pivot points : price is over resistance 1
Type : Neutral
Timeframe : Daily
Pivot points : price is under support 3
Type : Neutral
Timeframe : Weekly
MACD indicator is back under 0
Type : Bearish
Timeframe : Daily
Price is back under the pivot point
Type : Bearish
Timeframe : Daily
The Central Patterns scanner, which studies chart patterns, resistances and supports, has identified this signal:
Horizontal resistance is broken
Type : Bullish
Timeframe : Daily
The Central Candlesticks scanner which studies Japanese candlesticks did not detect anything.
| S3 | S2 | S1 | Price | R1 | R2 | |
|---|---|---|---|---|---|---|
| ProTrendLines | 21.61 | 24.42 | 31.16 | 33.99 | 36.67 | 43.53 |
| Change (%) | -36.42% | -28.16% | -8.33% | - | +7.88% | +28.07% |
| Change | -12.38 | -9.57 | -2.83 | - | +2.68 | +9.54 |
| Level | Minor | Minor | Major | - | Minor | Major |
To determine price objectives, it is also possible to use the pivot points. Here is the price position in relation to pivot points:
| Pivot points | S3 | S2 | S1 | PP | R1 | R2 | R3 |
|---|---|---|---|---|---|---|---|
| Standard | 28.83 | 30.05 | 30.81 | 32.03 | 32.79 | 34.01 | 34.77 |
| Camarilla | 31.04 | 31.22 | 31.40 | 31.58 | 31.76 | 31.94 | 32.12 |
| Woodie | 28.61 | 29.94 | 30.59 | 31.92 | 32.57 | 33.90 | 34.55 |
| Fibonacci | 30.05 | 30.80 | 31.27 | 32.03 | 32.78 | 33.25 | 34.01 |
| Pivot points | S3 | S2 | S1 | PP | R1 | R2 | R3 |
|---|---|---|---|---|---|---|---|
| Standard | 37.74 | 38.87 | 40.82 | 41.95 | 43.90 | 45.03 | 46.98 |
| Camarilla | 41.91 | 42.20 | 42.48 | 42.76 | 43.04 | 43.33 | 43.61 |
| Woodie | 38.14 | 39.08 | 41.22 | 42.16 | 44.30 | 45.24 | 47.38 |
| Fibonacci | 38.87 | 40.05 | 40.78 | 41.95 | 43.13 | 43.86 | 45.03 |
| Pivot points | S3 | S2 | S1 | PP | R1 | R2 | R3 |
|---|---|---|---|---|---|---|---|
| Standard | 21.20 | 25.93 | 33.40 | 38.13 | 45.60 | 50.33 | 57.80 |
| Camarilla | 37.53 | 38.64 | 39.76 | 40.88 | 42.00 | 43.12 | 44.24 |
| Woodie | 22.58 | 26.62 | 34.78 | 38.82 | 46.98 | 51.02 | 59.18 |
| Fibonacci | 25.93 | 30.59 | 33.47 | 38.13 | 42.79 | 45.67 | 50.33 |
Numerical data
The following is the status of technical indicators and moving averages registered at the time this technical analysis was created:
| RSI (14): | 38.23 | |
| MACD (12,26,9): | -0.3700 | |
| Directional Movement: | -19.04 | |
| AROON (14): | -71.42 | |
| DEMA (21): | 38.75 | |
| Parabolic SAR (0,02-0,02-0,2): | 41.18 | |
| Elder Ray (13): | -5.05 | |
| Super Trend (3,10): | 40.00 | |
| Zig ZAG (10): | 33.99 | |
| VORTEX (21): | 0.9600 | |
| Stochastique (14,3,5): | 13.76 | |
| TEMA (21): | 36.79 | |
| Williams %R (14): | -75.12 | |
| Chande Momentum Oscillator (20): | -9.50 | |
| Repulse (5,40,3): | 0.2700 | |
| ROCnROLL: | 2 | |
| TRIX (15,9): | 0.4800 | |
| Courbe Coppock: | 21.69 |
| MA7: | 37.61 | |
| MA20: | 40.54 | |
| MA50: | 36.42 | |
| MA100: | 31.03 | |
| MAexp7: | 36.40 | |
| MAexp20: | 38.48 | |
| MAexp50: | 36.48 | |
| MAexp100: | 32.86 | |
| Price / MA7: | -9.63% | |
| Price / MA20: | -16.16% | |
| Price / MA50: | -6.67% | |
| Price / MA100: | +9.54% | |
| Price / MAexp7: | -6.62% | |
| Price / MAexp20: | -11.67% | |
| Price / MAexp50: | -6.83% | |
| Price / MAexp100: | +3.44% |
News
The last news published on PINDUODUO INC. ADS at the time of the generation of this analysis was as follows:
- Pinduoduo Announces Third Quarter 2019 Unaudited Financial Results
- Pinduoduo to Report Third Quarter 2019 Unaudited Financial Results on Nov 20, 2019
- Pinduoduo Announces Proposed Offering of US$875 Million Convertible Senior Notes
- Pinduoduo Announces Second Quarter 2019 Unaudited Financial Results and Appoints New Independent Director
- Pinduoduo to Report Second Quarter 2019 Unaudited Financial Results on Aug 21, 2019
About author

Online


Add a comment
Comments
0 comments on the analysis PDD HOLDINGS INC. ADS - Daily