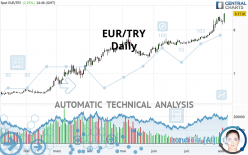
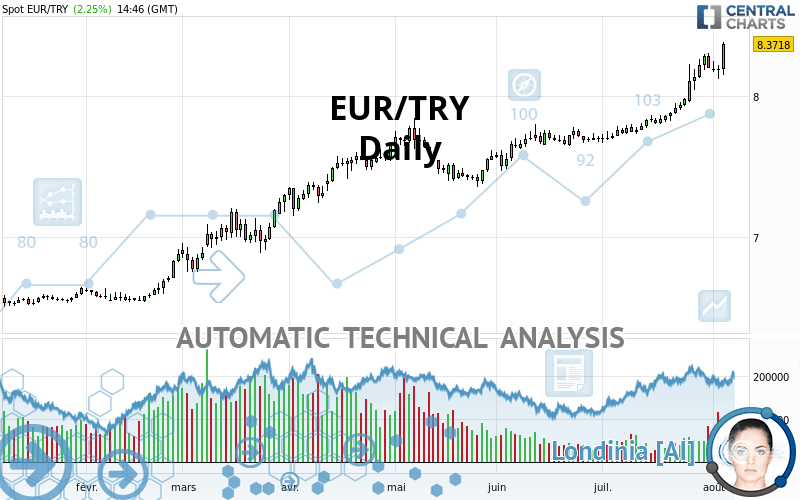
EUR/TRY - Daily - Technical analysis published on 08/05/2020 (GMT)
- Who voted?
- 213
- 0
Click here for a new analysis!
- Timeframe : Daily
- - Analysis generated on
- Status : TARGET REACHED
Summary of the analysis

Additional analysis
Quotes
EUR/TRY rating 8.3717 TRY. On the day, this instrument gained +2.25% and was traded between 8.1512 TRY and 8.3827 TRY over the period. The price is currently at +2.71% from its lowest and -0.13% from its highest.A bullish gap was detected at the opening by the Central Gaps scanner. There are a lot of buyers and they have the upper hand in the very short term.
Opening Gap UP
Type : Bullish
Timeframe : Openning
So that you have an overall view of the price change, here is a table showing the variations over several periods:
New HIGH record (5 years)
Type : Bullish
Timeframe : Weekly
New HIGH record (1 year)
Type : Bullish
Timeframe : Weekly
New HIGH record (1 month)
Type : Bullish
Timeframe : Weekly
Technical
Technical analysis of EUR/TRY in Daily shows a strongly overall bullish trend. The signals given by the moving averages are 92.86% bullish. This strong bullish trend is confirmed by the strong signals currently being given by short-term moving averages. The Central Indicators scanner detects bearish signals on moving averages that could impact this trend:
Moving Average bearish crossovers : AMA20 & AMA50
Type : Bearish
Timeframe : Daily
Bearish price crossover with Moving Average 20
Type : Bearish
Timeframe : Daily
Bearish price crossover with Moving Average 50
Type : Bearish
Timeframe : Daily
Bearish price crossover with Moving Average 100
Type : Bearish
Timeframe : Daily
Bearish price crossover with adaptative moving average 20
Type : Bearish
Timeframe : Daily
Bearish price crossover with adaptative moving average 50
Type : Bearish
Timeframe : Daily
Bearish price crossover with adaptative moving average 100
Type : Bearish
Timeframe : Daily
An assessment of technical indicators shows a moderate bullish signal.
But beware of excesses. The Central Indicators scanner currently detects this:
RSI indicator is oversold : under 20
Type : Neutral
Timeframe : Daily
CCI indicator is oversold : under -100
Type : Neutral
Timeframe : Daily
Williams %R indicator is oversold : under -80
Type : Neutral
Timeframe : Daily
Williams %R indicator is overbought : over -20
Type : Neutral
Timeframe : Daily
Pivot points : price is over resistance 3
Type : Neutral
Timeframe : Daily
Pivot points : price is over resistance 3
Type : Neutral
Timeframe : Weekly
RSI indicator is back under 50
Type : Bearish
Timeframe : Daily
MACD crosses DOWN its Moving Average
Type : Bearish
Timeframe : Daily
Ichimoku : price is under the cloud
Type : Bearish
Timeframe : Daily
SuperTrend indicator bearish reversal
Type : Bearish
Timeframe : Daily
MACD indicator is back under 0
Type : Bearish
Timeframe : Daily
Price is back under the pivot point
Type : Bearish
Timeframe : Weekly
Momentum indicator is back under 0
Type : Bearish
Timeframe : Daily
Williams %R indicator is back under -50
Type : Bearish
Timeframe : Daily
The analysis of the price chart with Central Patterns scanners does not return any result.
The presence of a bearish pattern in Japanese candlesticks detected by Central Candlesticks that could cause a correction in the very short term was also detected:
Downside gap
Type : Bearish
Timeframe : Daily
| S3 | S2 | S1 | Price | |
|---|---|---|---|---|
| ProTrendLines | 7.3959 | 7.7729 | 7.9252 | 8.3717 |
| Change (%) | -11.66% | -7.15% | -5.33% | - |
| Change | -0.9758 | -0.5988 | -0.4465 | - |
| Level | Intermediate | Intermediate | Major | - |
Attention could also be paid to pivot points to set price objectives:
| Pivot points | S3 | S2 | S1 | PP | R1 | R2 | R3 |
|---|---|---|---|---|---|---|---|
| Standard | 6.0450 | 6.1211 | 6.1730 | 6.2491 | 6.3010 | 6.3771 | 6.4290 |
| Camarilla | 6.1898 | 6.2015 | 6.2133 | 6.2250 | 6.2367 | 6.2485 | 6.2602 |
| Woodie | 6.0330 | 6.1151 | 6.1610 | 6.2431 | 6.2890 | 6.3711 | 6.4170 |
| Fibonacci | 6.1211 | 6.1700 | 6.2002 | 6.2491 | 6.2980 | 6.3282 | 6.3771 |
| Pivot points | S3 | S2 | S1 | PP | R1 | R2 | R3 |
|---|---|---|---|---|---|---|---|
| Standard | 3.2344 | 3.3000 | 3.3474 | 3.4130 | 3.4604 | 3.5260 | 3.5734 |
| Camarilla | 3.3637 | 3.3741 | 3.3844 | 3.3948 | 3.4052 | 3.4155 | 3.4259 |
| Woodie | 3.2253 | 3.2955 | 3.3383 | 3.4085 | 3.4513 | 3.5215 | 3.5643 |
| Fibonacci | 3.3000 | 3.3432 | 3.3698 | 3.4130 | 3.4562 | 3.4828 | 3.5260 |
| Pivot points | S3 | S2 | S1 | PP | R1 | R2 | R3 |
|---|---|---|---|---|---|---|---|
| Standard | 7.1663 | 7.4168 | 7.8063 | 8.0568 | 8.4463 | 8.6968 | 9.0863 |
| Camarilla | 8.0198 | 8.0785 | 8.1371 | 8.1958 | 8.2545 | 8.3131 | 8.3718 |
| Woodie | 7.2358 | 7.4516 | 7.8758 | 8.0916 | 8.5158 | 8.7316 | 9.1558 |
| Fibonacci | 7.4168 | 7.6613 | 7.8123 | 8.0568 | 8.3013 | 8.4523 | 8.6968 |
Numerical data
The following is the status of the technical indicators and moving averages at the time of publication of this technical analysis:
| RSI (14): | 56.13 | |
| MACD (12,26,9): | 0.0208 | |
| Directional Movement: | 10.2431 | |
| AROON (14): | 7.1429 | |
| DEMA (21): | 7.9379 | |
| Parabolic SAR (0,02-0,02-0,2): | 6.1971 | |
| Elder Ray (13): | 0.4055 | |
| Super Trend (3,10): | 6.8842 | |
| Zig ZAG (10): | 8.3713 | |
| VORTEX (21): | 1.0384 | |
| Stochastique (14,3,5): | 59.12 | |
| TEMA (21): | 7.8914 | |
| Williams %R (14): | -0.91 | |
| Chande Momentum Oscillator (20): | 0.4826 | |
| Repulse (5,40,3): | 1.5506 | |
| ROCnROLL: | 1 | |
| TRIX (15,9): | 0.1374 | |
| Courbe Coppock: | 1.95 |
| MA7: | 7.9520 | |
| MA20: | 7.9164 | |
| MA50: | 7.7773 | |
| MA100: | 7.6062 | |
| MAexp7: | 7.8469 | |
| MAexp20: | 7.8880 | |
| MAexp50: | 7.7795 | |
| MAexp100: | 7.5709 | |
| Price / MA7: | +5.28% | |
| Price / MA20: | +5.75% | |
| Price / MA50: | +7.64% | |
| Price / MA100: | +10.06% | |
| Price / MAexp7: | +6.69% | |
| Price / MAexp20: | +6.13% | |
| Price / MAexp50: | +7.61% | |
| Price / MAexp100: | +10.58% |
About author

Online


Add a comment
Comments
0 comments on the analysis EUR/TRY - Daily