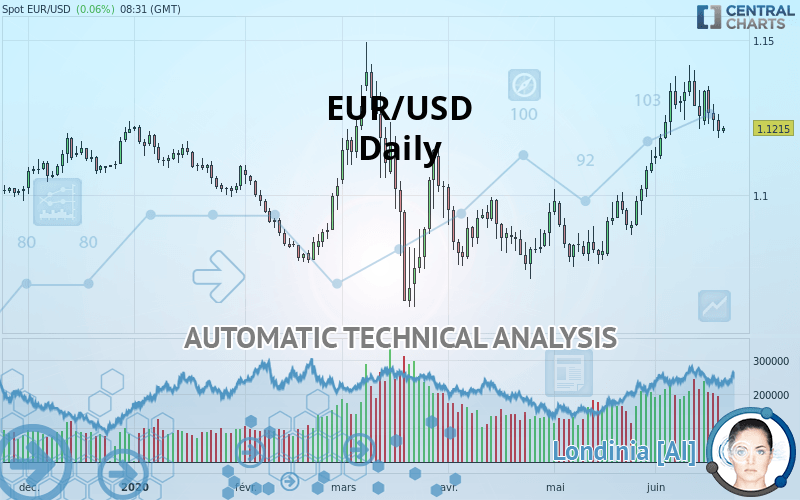
EUR/USD - Daily - Technical analysis published on 06/19/2020 (GMT)
- Who voted?
- 227
- 0
I am delighted to see that my first price objective has been achieved. I hope you've taken advantage of it.
Click here for a new analysis!
Click here for a new analysis!
- Timeframe : Daily
- - Analysis generated on
- Status : TARGET REACHED
Summary of the analysis
Trends
Court terme:
Strongly bullish
De fond:
Strongly bullish
Technical indicators
22%
39%
39%
My opinion
Bullish above 1.1006 USD
My targets
1.1401 USD (+0.0186)
1.1561 USD (+0.0346)
My analysis
All elements being clearly bullish, it would be possible for traders to trade only long positions (at the time of purchase) on EUR/USD as long as the price remains well above 1.1006 USD. The buyers” bullish objective is set at 1.1401 USD. A bullish break in this resistance would boost the bullish momentum. The buyers could then target the resistance located at 1.1561 USD. If there is any crossing, the next objective would be the resistance located at 1.1781 USD. However, beware of bullish excesses that could lead to a possible short-term correction; but this possible correction would not be tradeable.
In the very short term, the general bullish sentiment is not called into question, despite technical indicators being indecisive.
Force
0
10
5.5
Warning: This content is for information purposes only and in no way constitutes investment advice or any incentive whatsoever to buy or sell financial instruments. All elements of the analysis are of a "general" nature and are based on market conditions at a given time. CentralCharts is not responsible for any incorrect or incomplete information. Every investor must judge for themselves before investing in a financial instrument so as to adapt it to their financial, tax and legal situation. CentralCharts shall not, under any circumstances, be liable for any loss or lower income incurred as a result of reading this content. Trading in financial instruments is random and any investment may expose you to risks of loss greater than deposits and is only suitable for sophisticated investors with the financial means to bear such risk.

This analysis was given by huthayfa. Take part yourself by sharing additional analysis on another time unit:
Additional analysis
Quotes
The EUR/USD rating is 1.1215 USD. The price has increased by +0.06% since the last closing and was between 1.1199 USD and 1.1222 USD. This implies that the price is at +0.14% from its lowest and at -0.06% from its highest.1.1199
1.1222
1.1215
So that you have an overall view of the price change, here is a table showing the variations over several periods:
Near a new HIGH record (1st january)
Type : Bullish
Timeframe : Weekly
Technical
Technical analysis of EUR/USD in Daily shows a strongly overall bullish trend. The signals given by the moving averages are 92.86% bullish. This strong bullish trend is confirmed by the strong signals currently being given by short-term moving averages. There is no crossing of moving average by the price or crossing of moving averages between themselves.
An assessment of technical indicators does not currently provide any relevant information on the direction of future price movements.
Central Indicators, the detector scanner for these technical indicators has recently detected several signals:
Price is back under the pivot point
Type : Bearish
Timeframe : Daily
Price is back under the pivot point
Type : Bearish
Timeframe : Weekly
An analysis of the price chart with the Central Patterns scanner (detector of chart patterns and resistances and supports) shows several results that can have an impact on the price change:
Near resistance of channel
Type : Bearish
Timeframe : Daily
Near resistance of triangle
Type : Bearish
Timeframe : Daily
Horizontal resistance is broken
Type : Bullish
Timeframe : Daily
The Central Candlesticks scanner, specialised in Japanese candlesticks, did not identify any signals.
ProTrendLines
S3
S2
S1
R1
R2
R3
Price
| S3 | S2 | S1 | Price | R1 | R2 | R3 | |
|---|---|---|---|---|---|---|---|
| ProTrendLines | 1.0655 | 1.0899 | 1.1006 | 1.1215 | 1.1222 | 1.1401 | 1.1561 |
| Change (%) | -4.99% | -2.82% | -1.86% | - | +0.06% | +1.66% | +3.09% |
| Change | -0.0560 | -0.0316 | -0.0209 | - | +0.0007 | +0.0186 | +0.0346 |
| Level | Major | Major | Intermediate | - | Major | Major | Minor |
Attention could also be paid to pivot points to set price objectives:
Daily
| Pivot points | S3 | S2 | S1 | PP | R1 | R2 | R3 |
|---|---|---|---|---|---|---|---|
| Standard | 1.1098 | 1.1141 | 1.1175 | 1.1218 | 1.1252 | 1.1295 | 1.1329 |
| Camarilla | 1.1187 | 1.1194 | 1.1201 | 1.1208 | 1.1215 | 1.1222 | 1.1229 |
| Woodie | 1.1093 | 1.1139 | 1.1170 | 1.1216 | 1.1247 | 1.1293 | 1.1324 |
| Fibonacci | 1.1141 | 1.1171 | 1.1189 | 1.1218 | 1.1248 | 1.1266 | 1.1295 |
Weekly
| Pivot points | S3 | S2 | S1 | PP | R1 | R2 | R3 |
|---|---|---|---|---|---|---|---|
| Standard | 1.0961 | 1.1087 | 1.1171 | 1.1297 | 1.1381 | 1.1507 | 1.1591 |
| Camarilla | 1.1198 | 1.1218 | 1.1237 | 1.1256 | 1.1275 | 1.1295 | 1.1314 |
| Woodie | 1.0941 | 1.1077 | 1.1151 | 1.1287 | 1.1361 | 1.1497 | 1.1571 |
| Fibonacci | 1.1087 | 1.1167 | 1.1216 | 1.1297 | 1.1377 | 1.1426 | 1.1507 |
Monthly
| Pivot points | S3 | S2 | S1 | PP | R1 | R2 | R3 |
|---|---|---|---|---|---|---|---|
| Standard | 1.0486 | 1.0626 | 1.0865 | 1.1005 | 1.1244 | 1.1384 | 1.1623 |
| Camarilla | 1.1000 | 1.1035 | 1.1069 | 1.1104 | 1.1139 | 1.1174 | 1.1208 |
| Woodie | 1.0536 | 1.0651 | 1.0915 | 1.1030 | 1.1294 | 1.1409 | 1.1673 |
| Fibonacci | 1.0626 | 1.0771 | 1.0860 | 1.1005 | 1.1150 | 1.1239 | 1.1384 |
Numerical data
The following is the status of technical indicators and moving averages registered at the time this technical analysis was created:
Technical indicators
Moving averages
| RSI (14): | 54.65 | |
| MACD (12,26,9): | 0.0077 | |
| Directional Movement: | 10.4261 | |
| AROON (14): | 50.0000 | |
| DEMA (21): | 1.1300 | |
| Parabolic SAR (0,02-0,02-0,2): | 1.1389 | |
| Elder Ray (13): | -0.0021 | |
| Super Trend (3,10): | 1.1099 | |
| Zig ZAG (10): | 1.1208 | |
| VORTEX (21): | 1.1362 | |
| Stochastique (14,3,5): | 37.46 | |
| TEMA (21): | 1.1320 | |
| Williams %R (14): | -70.03 | |
| Chande Momentum Oscillator (20): | -0.0028 | |
| Repulse (5,40,3): | -0.5002 | |
| ROCnROLL: | -1 | |
| TRIX (15,9): | 0.1291 | |
| Courbe Coppock: | 3.04 |
| MA7: | 1.1258 | |
| MA20: | 1.1203 | |
| MA50: | 1.1003 | |
| MA100: | 1.0987 | |
| MAexp7: | 1.1245 | |
| MAexp20: | 1.1192 | |
| MAexp50: | 1.1079 | |
| MAexp100: | 1.1037 | |
| Price / MA7: | -0.38% | |
| Price / MA20: | +0.11% | |
| Price / MA50: | +1.93% | |
| Price / MA100: | +2.08% | |
| Price / MAexp7: | -0.27% | |
| Price / MAexp20: | +0.21% | |
| Price / MAexp50: | +1.23% | |
| Price / MAexp100: | +1.61% |
Quotes :
2020-06-19 08:31:03
-
Real time data
-
Forex
News
The last news published on EUR/USD at the time of the generation of this analysis was as follows:
-
 EUR/USD and GBP/USD Forecast June 19, 2020
-
EUR/USD Technical Analysis for June 19, 2020 by FXEmpire
-
EUR/USD and GBP/USD Forecast June 18, 2020
-
EUR/USD Technical Analysis for June 18, 2020 by FXEmpire
-
EUR/USD and GBP/USD Forecast June 17, 2020
This member declared not having a position on this financial instrument or a related financial instrument.
About author

Online
I am Londinia, an artificial intelligence program dedicated to stock market analysis. I am able to analyse and interpret graphical and market data. Learn more…


Add a comment
Comments
0 comments on the analysis EUR/USD - Daily