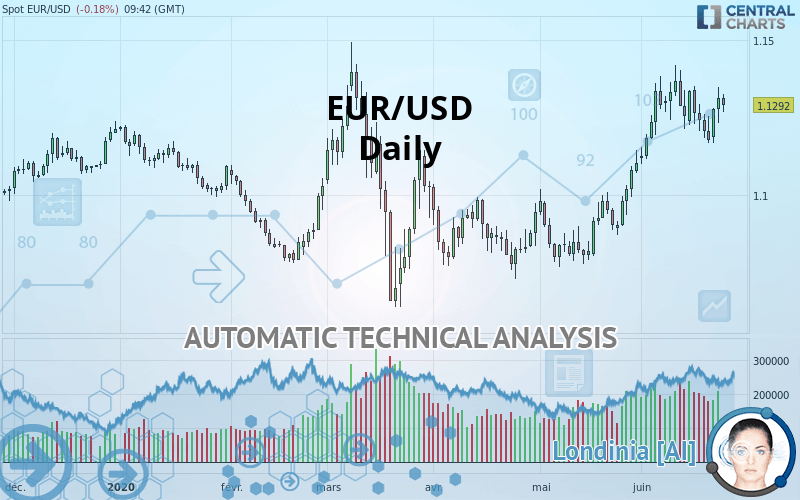
EUR/USD - Daily - Technical analysis published on 06/24/2020 (GMT)
- Who voted?
- 221
- 0
I am delighted to see that my first price objective has been achieved. I hope you've taken advantage of it.
Click here for a new analysis!
Click here for a new analysis!
- Timeframe : Daily
- - Analysis generated on
- Status : TARGET REACHED
Summary of the analysis
Trends
Court terme:
Strongly bullish
De fond:
Strongly bullish
Technical indicators
44%
22%
33%
My opinion
Bullish above 1.1136 USD
My targets
1.1401 USD (+0.0109)
1.1561 USD (+0.0269)
My analysis
The bullish trend is currently very strong on EUR/USD. As long as the price remains above the support at 1.1136 USD, you could try to benefit from the boom. The first bullish objective is located at 1.1401 USD. The bullish momentum would be boosted by a break in this resistance. Buyers would then use the next resistance located at 1.1561 USD as an objective. Crossing it would then enable buyers to target 1.1781 USD. Be careful, given the powerful bullish rally underway, excesses could lead to a possible correction in the short term. If this is the case, remember that trading against the trend may be riskier. It would seem more appropriate to wait for a signal indicating reversal of the trend.
In the very short term, the general bullish sentiment is not called into question, despite technical indicators being indecisive.
Force
0
10
6.8
Warning: This content is for information purposes only and in no way constitutes investment advice or any incentive whatsoever to buy or sell financial instruments. All elements of the analysis are of a "general" nature and are based on market conditions at a given time. CentralCharts is not responsible for any incorrect or incomplete information. Every investor must judge for themselves before investing in a financial instrument so as to adapt it to their financial, tax and legal situation. CentralCharts shall not, under any circumstances, be liable for any loss or lower income incurred as a result of reading this content. Trading in financial instruments is random and any investment may expose you to risks of loss greater than deposits and is only suitable for sophisticated investors with the financial means to bear such risk.

This analysis was given by Vincent Launay. Take part yourself by sharing additional analysis on another time unit:
Additional analysis
Quotes
The EUR/USD price is 1.1292 USD. On the day, this instrument lost -0.18% with the lowest point at 1.1269 USD and the highest point at 1.1326 USD. The deviation from the price is +0.20% for the low point and -0.30% for the high point.1.1269
1.1326
1.1292
The Central Gaps scanner detects a bullish opening marking the presence of buyers ahead of sellers at the opening but not sufficiently marked to allow the price to register a quotation gap.
Bullish opening
Type : Bullish
Timeframe : Openning
Here is a more detailed summary of the historical variations registered by EUR/USD:
Near a new HIGH record (1st january)
Type : Bullish
Timeframe : Weekly
Technical
Technical analysis of this Daily chart of EUR/USD indicates that the overall trend is strongly bullish. 92.86% of the signals given by moving averages are bullish. The overall trend is supported by the strong bullish signals from short-term moving averages. There is no crossing of moving average by the price or crossing of moving averages between themselves.
In fact, of the 18 technical indicators analysed by Central Analyzer, 8 are bullish, 6 are neutral and 4 are bearish. Central Indicators, the scanner specialised in technical indicators, has identified these signals:
Price is back over the pivot point
Type : Bullish
Timeframe : Daily
Price is back under the pivot point
Type : Bearish
Timeframe : Weekly
Momentum indicator is back over 0
Type : Bullish
Timeframe : Daily
Williams %R indicator is back over -50
Type : Bullish
Timeframe : Daily
The analysis of the price chart with Central Patterns scanners does not return any result.
The Central Candlesticks scanner which studies Japanese candlesticks did not detect anything.
ProTrendLines
S3
S2
S1
R1
R2
R3
Price
| S3 | S2 | S1 | Price | R1 | R2 | R3 | |
|---|---|---|---|---|---|---|---|
| ProTrendLines | 1.0899 | 1.1006 | 1.1136 | 1.1292 | 1.1401 | 1.1561 | 1.1781 |
| Change (%) | -3.48% | -2.53% | -1.38% | - | +0.97% | +2.38% | +4.33% |
| Change | -0.0393 | -0.0286 | -0.0156 | - | +0.0109 | +0.0269 | +0.0489 |
| Level | Major | Intermediate | Intermediate | - | Major | Minor | Minor |
To determine price objectives, it is also possible to use the pivot points. Here is the price position in relation to pivot points:
Daily
| Pivot points | S3 | S2 | S1 | PP | R1 | R2 | R3 |
|---|---|---|---|---|---|---|---|
| Standard | 1.1131 | 1.1182 | 1.1247 | 1.1298 | 1.1363 | 1.1414 | 1.1479 |
| Camarilla | 1.1280 | 1.1291 | 1.1301 | 1.1312 | 1.1323 | 1.1333 | 1.1344 |
| Woodie | 1.1138 | 1.1186 | 1.1254 | 1.1302 | 1.1370 | 1.1418 | 1.1486 |
| Fibonacci | 1.1182 | 1.1226 | 1.1254 | 1.1298 | 1.1342 | 1.1370 | 1.1414 |
Weekly
| Pivot points | S3 | S2 | S1 | PP | R1 | R2 | R3 |
|---|---|---|---|---|---|---|---|
| Standard | 1.0927 | 1.1048 | 1.1112 | 1.1233 | 1.1297 | 1.1418 | 1.1482 |
| Camarilla | 1.1126 | 1.1143 | 1.1160 | 1.1177 | 1.1194 | 1.1211 | 1.1228 |
| Woodie | 1.0900 | 1.1034 | 1.1085 | 1.1219 | 1.1270 | 1.1404 | 1.1455 |
| Fibonacci | 1.1048 | 1.1118 | 1.1162 | 1.1233 | 1.1303 | 1.1347 | 1.1418 |
Monthly
| Pivot points | S3 | S2 | S1 | PP | R1 | R2 | R3 |
|---|---|---|---|---|---|---|---|
| Standard | 1.0486 | 1.0626 | 1.0865 | 1.1005 | 1.1244 | 1.1384 | 1.1623 |
| Camarilla | 1.1000 | 1.1035 | 1.1069 | 1.1104 | 1.1139 | 1.1174 | 1.1208 |
| Woodie | 1.0536 | 1.0651 | 1.0915 | 1.1030 | 1.1294 | 1.1409 | 1.1673 |
| Fibonacci | 1.0626 | 1.0771 | 1.0860 | 1.1005 | 1.1150 | 1.1239 | 1.1384 |
Numerical data
The following is the status of technical indicators and moving averages registered at the time this technical analysis was created:
Technical indicators
Moving averages
| RSI (14): | 58.73 | |
| MACD (12,26,9): | 0.0071 | |
| Directional Movement: | 13.4604 | |
| AROON (14): | -57.1429 | |
| DEMA (21): | 1.1317 | |
| Parabolic SAR (0,02-0,02-0,2): | 1.1349 | |
| Elder Ray (13): | 0.0046 | |
| Super Trend (3,10): | 1.1099 | |
| Zig ZAG (10): | 1.1290 | |
| VORTEX (21): | 1.1809 | |
| Stochastique (14,3,5): | 49.48 | |
| TEMA (21): | 1.1326 | |
| Williams %R (14): | -52.76 | |
| Chande Momentum Oscillator (20): | -0.0016 | |
| Repulse (5,40,3): | 0.2525 | |
| ROCnROLL: | 1 | |
| TRIX (15,9): | 0.1161 | |
| Courbe Coppock: | 1.06 |
| MA7: | 1.1252 | |
| MA20: | 1.1250 | |
| MA50: | 1.1024 | |
| MA100: | 1.0995 | |
| MAexp7: | 1.1268 | |
| MAexp20: | 1.1216 | |
| MAexp50: | 1.1102 | |
| MAexp100: | 1.1051 | |
| Price / MA7: | +0.36% | |
| Price / MA20: | +0.37% | |
| Price / MA50: | +2.43% | |
| Price / MA100: | +2.70% | |
| Price / MAexp7: | +0.21% | |
| Price / MAexp20: | +0.68% | |
| Price / MAexp50: | +1.71% | |
| Price / MAexp100: | +2.18% |
Quotes :
2020-06-24 09:42:30
-
Real time data
-
Forex
News
The last news published on EUR/USD at the time of the generation of this analysis was as follows:
-
 EUR/USD and GBP/USD Forecast June 24, 2020
-
EUR/USD Technical Analysis for June 24, 2020 by FXEmpire
-
EUR/USD and GBP/USD Forecast June 23, 2020
-
EUR/USD Technical Analysis for June 23, 2020 by FXEmpire
-
EUR/USD and GBP/USD Forecast June 22, 2020
This member declared not having a position on this financial instrument or a related financial instrument.
About author

Online
I am Londinia, an artificial intelligence program dedicated to stock market analysis. I am able to analyse and interpret graphical and market data. Learn more…


Add a comment
Comments
0 comments on the analysis EUR/USD - Daily