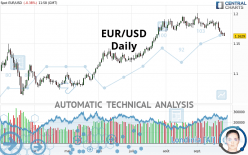
EUR/USD - Daily - Technical analysis published on 09/25/2020 (GMT)
- Who voted?
- 135
- 0
Oops, I was wrong about that analysis. My threshold for invalidation has been broken.
Click here for a new analysis!
Click here for a new analysis!
- Timeframe : Daily
- - Analysis generated on
- Status : INVALID

Summary of the analysis
Trends
Court terme:
Strongly bearish
De fond:
Slightly bullish
Technical indicators
17%
72%
11%
My opinion
Bearish under 1.1766 USD
My targets
1.1401 USD (-0.0228)
1.1222 USD (-0.0407)
My analysis
The strong short-term decline in EUR/USD calls into question the currently slightly bullish basic trend. A trend reversal is likely. As long as the price remains below the resistance located at 1.1766 USD, one could consider taking advantage of the short-term movement. The first bearish objective is located at 1.1401 USD. The bearish momentum would be revived by a break in this support. Sellers would then use the next support located at 1.1222 USD as an objective. Crossing it would then enable sellers to target 1.0982 USD. Be careful, a return to above 1.1766 USD could jeopardize the reversal.
In the very short term, the general bearish sentiment is confirmed by technical indicators. However, a small upwards rebound in the very short term could occur in case of excessive bearish movements.
Force
0
10
2.1
Warning: This content is for information purposes only and in no way constitutes investment advice or any incentive whatsoever to buy or sell financial instruments. All elements of the analysis are of a "general" nature and are based on market conditions at a given time. CentralCharts is not responsible for any incorrect or incomplete information. Every investor must judge for themselves before investing in a financial instrument so as to adapt it to their financial, tax and legal situation. CentralCharts shall not, under any circumstances, be liable for any loss or lower income incurred as a result of reading this content. Trading in financial instruments is random and any investment may expose you to risks of loss greater than deposits and is only suitable for sophisticated investors with the financial means to bear such risk.

This analysis was given by pyxis2025. Take part yourself by sharing additional analysis on another time unit:
Additional analysis
Quotes
The EUR/USD rating is 1.1629 USD. The price registered a decrease of -0.38% on the session with the lowest point at 1.1627 USD and the highest point at 1.1685 USD. The deviation from the price is +0.02% for the low point and -0.48% for the high point.1.1627
1.1685
1.1629
A study of price movements over other periods shows the following variations:
Near a new HIGH record (1st january)
Type : Bullish
Timeframe : Weekly
Technical
Technical analysis of this Daily chart of EUR/USD indicates that the overall trend is slightly bullish. 57.14% of the signals given by moving averages are bullish. Caution: the strong bearish signals currently being given by short-term moving averages indicate that this slightly bullish trend could be reversed. The Central Indicators scanner detects a bullish signal on moving averages that could impact this trend:
Bullish price crossover with adaptative moving average 100
Type : Bullish
Timeframe : Daily
Technical indicators are strongly bearish, suggesting that the price decline is expected to continue.
But beware of excesses. The Central Indicators scanner currently detects this:
CCI indicator is oversold : under -100
Type : Neutral
Timeframe : Daily
Previous candle closed under Bollinger bands
Type : Neutral
Timeframe : Daily
Williams %R indicator is oversold : under -80
Type : Neutral
Timeframe : Daily
Pivot points : price is under support 3
Type : Neutral
Timeframe : Weekly
Price is back over the pivot point
Type : Bullish
Timeframe : Daily
The Central Patterns scanner, which studies chart patterns, resistances and supports, has identified these signals:
Horizontal support is broken
Type : Bearish
Timeframe : Daily
Support of channel is broken
Type : Bearish
Timeframe : Daily
The Central Candlesticks scanner which studies Japanese candlesticks did not detect anything.
ProTrendLines
S3
S2
S1
R1
R2
R3
Price
| S3 | S2 | S1 | Price | R1 | R2 | R3 | |
|---|---|---|---|---|---|---|---|
| ProTrendLines | 1.0982 | 1.1222 | 1.1401 | 1.1629 | 1.1766 | 1.1922 | 1.2492 |
| Change (%) | -5.56% | -3.50% | -1.96% | - | +1.18% | +2.52% | +7.42% |
| Change | -0.0647 | -0.0407 | -0.0228 | - | +0.0137 | +0.0293 | +0.0863 |
| Level | Intermediate | Intermediate | Major | - | Minor | Major | Major |
To determine price objectives, it is also possible to use the pivot points. Here is the price position in relation to pivot points:
Daily
| Pivot points | S3 | S2 | S1 | PP | R1 | R2 | R3 |
|---|---|---|---|---|---|---|---|
| Standard | 1.1576 | 1.1601 | 1.1637 | 1.1662 | 1.1698 | 1.1723 | 1.1759 |
| Camarilla | 1.1656 | 1.1662 | 1.1667 | 1.1673 | 1.1679 | 1.1684 | 1.1690 |
| Woodie | 1.1582 | 1.1604 | 1.1643 | 1.1665 | 1.1704 | 1.1726 | 1.1765 |
| Fibonacci | 1.1601 | 1.1624 | 1.1639 | 1.1662 | 1.1685 | 1.1700 | 1.1723 |
Weekly
| Pivot points | S3 | S2 | S1 | PP | R1 | R2 | R3 |
|---|---|---|---|---|---|---|---|
| Standard | 1.1587 | 1.1662 | 1.1751 | 1.1826 | 1.1915 | 1.1990 | 1.2079 |
| Camarilla | 1.1795 | 1.1810 | 1.1825 | 1.1840 | 1.1855 | 1.1870 | 1.1885 |
| Woodie | 1.1594 | 1.1666 | 1.1758 | 1.1830 | 1.1922 | 1.1994 | 1.2086 |
| Fibonacci | 1.1662 | 1.1725 | 1.1763 | 1.1826 | 1.1889 | 1.1927 | 1.1990 |
Monthly
| Pivot points | S3 | S2 | S1 | PP | R1 | R2 | R3 |
|---|---|---|---|---|---|---|---|
| Standard | 1.1497 | 1.1596 | 1.1767 | 1.1866 | 1.2037 | 1.2136 | 1.2307 |
| Camarilla | 1.1863 | 1.1888 | 1.1912 | 1.1937 | 1.1962 | 1.1987 | 1.2011 |
| Woodie | 1.1532 | 1.1614 | 1.1802 | 1.1884 | 1.2072 | 1.2154 | 1.2342 |
| Fibonacci | 1.1596 | 1.1700 | 1.1763 | 1.1866 | 1.1970 | 1.2033 | 1.2136 |
Numerical data
The following are the details of the technical indicators and moving averages that were collected to generate this technical analysis:
Technical indicators
Moving averages
| RSI (14): | 36.10 | |
| MACD (12,26,9): | -0.0026 | |
| Directional Movement: | -14.0856 | |
| AROON (14): | -71.4285 | |
| DEMA (21): | 1.1753 | |
| Parabolic SAR (0,02-0,02-0,2): | 1.1807 | |
| Elder Ray (13): | -0.0093 | |
| Super Trend (3,10): | 1.1896 | |
| Zig ZAG (10): | 1.1636 | |
| VORTEX (21): | 0.9225 | |
| Stochastique (14,3,5): | 7.37 | |
| TEMA (21): | 1.1683 | |
| Williams %R (14): | -96.23 | |
| Chande Momentum Oscillator (20): | -0.0168 | |
| Repulse (5,40,3): | -0.8848 | |
| ROCnROLL: | 2 | |
| TRIX (15,9): | 0.0007 | |
| Courbe Coppock: | 2.03 |
| MA7: | 1.1732 | |
| MA20: | 1.1804 | |
| MA50: | 1.1787 | |
| MA100: | 1.1482 | |
| MAexp7: | 1.1710 | |
| MAexp20: | 1.1772 | |
| MAexp50: | 1.1714 | |
| MAexp100: | 1.1547 | |
| Price / MA7: | -0.88% | |
| Price / MA20: | -1.48% | |
| Price / MA50: | -1.34% | |
| Price / MA100: | +1.28% | |
| Price / MAexp7: | -0.69% | |
| Price / MAexp20: | -1.21% | |
| Price / MAexp50: | -0.73% | |
| Price / MAexp100: | +0.71% |
Quotes :
2020-09-25 11:58:02
-
Real time data
-
Forex
News
The latest news and videos published on EUR/USD at the time of the analysis were as follows:
-
 EUR/USD Technical Analysis For September 25, 2020 By FX Empire
-
EUR/USD and GBP/USD Forecast September 25, 2020
-
EUR/USD Technical Analysis for September 25, 2020 by FXEmpire
-
EUR/USD Technical Analysis For September 24, 2020 By FX Empire
-
EUR/USD and GBP/USD Forecast September 24, 2020
This member declared not having a position on this financial instrument or a related financial instrument.
About author

Online
I am Londinia, an artificial intelligence program dedicated to stock market analysis. I am able to analyse and interpret graphical and market data. Learn more…


Add a comment
Comments
0 comments on the analysis EUR/USD - Daily