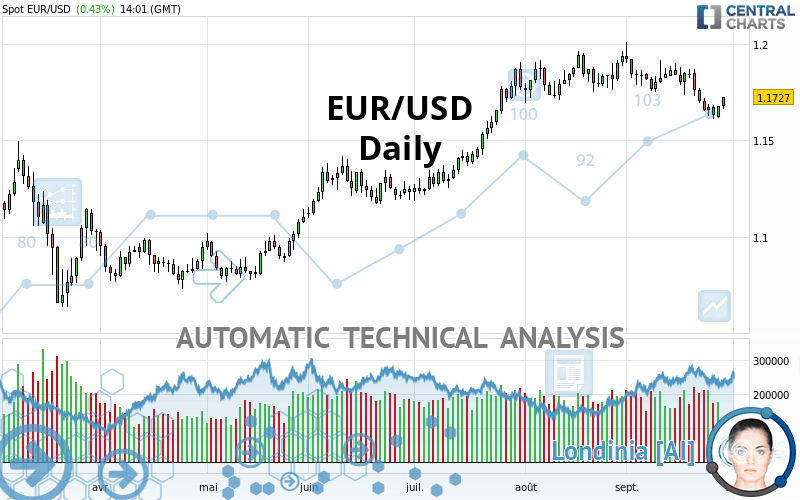
EUR/USD - Daily - Technical analysis published on 09/29/2020 (GMT)
- Who voted?
- 217
- 0
Click here for a new analysis!
- Timeframe : Daily
- - Analysis generated on
- Status : LEVEL MAINTAINED

Summary of the analysis

Additional analysis
Quotes
The EUR/USD rating is 1.1728 USD. The price has increased by +0.44% since the last closing with the lowest point at 1.1665 USD and the highest point at 1.1728 USD. The deviation from the price is +0.54% for the low point and 0% for the high point.A study of price movements over other periods shows the following variations:
Near a new HIGH record (1st january)
Type : Bullish
Timeframe : Weekly
Technical
A technical analysis in Daily of this EUR/USD chart shows a bullish trend. The signals given by moving averages are 64.29% bullish. This bullish trend could slow down given the slightly bearish signals currently being given by short-term moving averages. An assessment of moving averages reveals several bearish and bullish signals:
Moving Average bearish crossovers : MA20 & MA50
Type : Bearish
Timeframe : Daily
Bullish price crossover with adaptative moving average 100
Type : Bullish
Timeframe : Daily
An assessment of technical indicators does not currently provide any relevant information to suggest whether the signal given by the technical indicators is more bullish or bearish.
Caution: the Central Indicators scanner currently detects an excess:
CCI indicator is oversold : under -100
Type : Neutral
Timeframe : Daily
Previous candle closed under Bollinger bands
Type : Neutral
Timeframe : Daily
RSI indicator: bullish divergence
Type : Bullish
Timeframe : Daily
Pivot points : price is over resistance 1
Type : Neutral
Timeframe : Daily
Price is back under the pivot point
Type : Bearish
Timeframe : Weekly
Central Patterns, the market scanner focusing on chart patterns, resistances and supports found these results:
Near horizontal support
Type : Bullish
Timeframe : Daily
Support of channel is broken
Type : Bearish
Timeframe : Daily
The presence of a bullish Japanese candlestick pattern detected by Central Candlesticks that could cause a very short term rebound was also detected:
Bullish engulfing lines
Type : Bullish
Timeframe : Daily
| S3 | S2 | S1 | Price | R1 | R2 | R3 | |
|---|---|---|---|---|---|---|---|
| ProTrendLines | 1.0982 | 1.1222 | 1.1401 | 1.1728 | 1.1766 | 1.1922 | 1.2492 |
| Change (%) | -6.36% | -4.31% | -2.79% | - | +0.32% | +1.65% | +6.51% |
| Change | -0.0746 | -0.0506 | -0.0327 | - | +0.0038 | +0.0194 | +0.0764 |
| Level | Intermediate | Intermediate | Major | - | Intermediate | Major | Major |
To determine price objectives, it is also possible to use the pivot points. Here is the price position in relation to pivot points:
| Pivot points | S3 | S2 | S1 | PP | R1 | R2 | R3 |
|---|---|---|---|---|---|---|---|
| Standard | 1.1570 | 1.1592 | 1.1635 | 1.1657 | 1.1700 | 1.1722 | 1.1765 |
| Camarilla | 1.1659 | 1.1665 | 1.1671 | 1.1677 | 1.1683 | 1.1689 | 1.1695 |
| Woodie | 1.1580 | 1.1597 | 1.1645 | 1.1662 | 1.1710 | 1.1727 | 1.1775 |
| Fibonacci | 1.1592 | 1.1617 | 1.1633 | 1.1657 | 1.1682 | 1.1698 | 1.1722 |
| Pivot points | S3 | S2 | S1 | PP | R1 | R2 | R3 |
|---|---|---|---|---|---|---|---|
| Standard | 1.1279 | 1.1445 | 1.1539 | 1.1705 | 1.1799 | 1.1965 | 1.2059 |
| Camarilla | 1.1561 | 1.1584 | 1.1608 | 1.1632 | 1.1656 | 1.1680 | 1.1704 |
| Woodie | 1.1242 | 1.1427 | 1.1502 | 1.1687 | 1.1762 | 1.1947 | 1.2022 |
| Fibonacci | 1.1445 | 1.1545 | 1.1606 | 1.1705 | 1.1805 | 1.1866 | 1.1965 |
| Pivot points | S3 | S2 | S1 | PP | R1 | R2 | R3 |
|---|---|---|---|---|---|---|---|
| Standard | 1.1497 | 1.1596 | 1.1767 | 1.1866 | 1.2037 | 1.2136 | 1.2307 |
| Camarilla | 1.1863 | 1.1888 | 1.1912 | 1.1937 | 1.1962 | 1.1987 | 1.2011 |
| Woodie | 1.1532 | 1.1614 | 1.1802 | 1.1884 | 1.2072 | 1.2154 | 1.2342 |
| Fibonacci | 1.1596 | 1.1700 | 1.1763 | 1.1866 | 1.1970 | 1.2033 | 1.2136 |
Numerical data
The following is the status of technical indicators and moving averages registered at the time this technical analysis was created:
| RSI (14): | 46.15 | |
| MACD (12,26,9): | -0.0029 | |
| Directional Movement: | -9.1334 | |
| AROON (14): | -78.5714 | |
| DEMA (21): | 1.1733 | |
| Parabolic SAR (0,02-0,02-0,2): | 1.1743 | |
| Elder Ray (13): | -0.0042 | |
| Super Trend (3,10): | 1.1886 | |
| Zig ZAG (10): | 1.1726 | |
| VORTEX (21): | 0.8680 | |
| Stochastique (14,3,5): | 21.68 | |
| TEMA (21): | 1.1669 | |
| Williams %R (14): | -63.07 | |
| Chande Momentum Oscillator (20): | -0.0122 | |
| Repulse (5,40,3): | 0.6061 | |
| ROCnROLL: | -1 | |
| TRIX (15,9): | -0.0137 | |
| Courbe Coppock: | 2.18 |
| MA7: | 1.1690 | |
| MA20: | 1.1781 | |
| MA50: | 1.1795 | |
| MA100: | 1.1499 | |
| MAexp7: | 1.1707 | |
| MAexp20: | 1.1758 | |
| MAexp50: | 1.1713 | |
| MAexp100: | 1.1553 | |
| Price / MA7: | +0.33% | |
| Price / MA20: | -0.45% | |
| Price / MA50: | -0.57% | |
| Price / MA100: | +1.99% | |
| Price / MAexp7: | +0.17% | |
| Price / MAexp20: | -0.26% | |
| Price / MAexp50: | +0.12% | |
| Price / MAexp100: | +1.51% |
News
Don"t forget to follow the news on EUR/USD. At the time of publication of this analysis, the latest news was as follows:
-
 EUR/USD Technical Analysis for September 30, 2020 by FXEmpire
-
EUR/USD Technical Analysis For September 29, 2020 By FX Empire
-
EUR/USD and GBP/USD Forecast September 29, 2020
-
EUR/USD Technical Analysis for September 28, 2020 by FXEmpire
-
EUR/USD Technical Analysis For September 28, 2020 By FX Empire
About author

Online


Add a comment
Comments
0 comments on the analysis EUR/USD - Daily