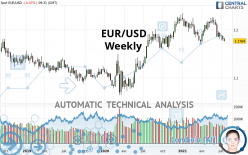
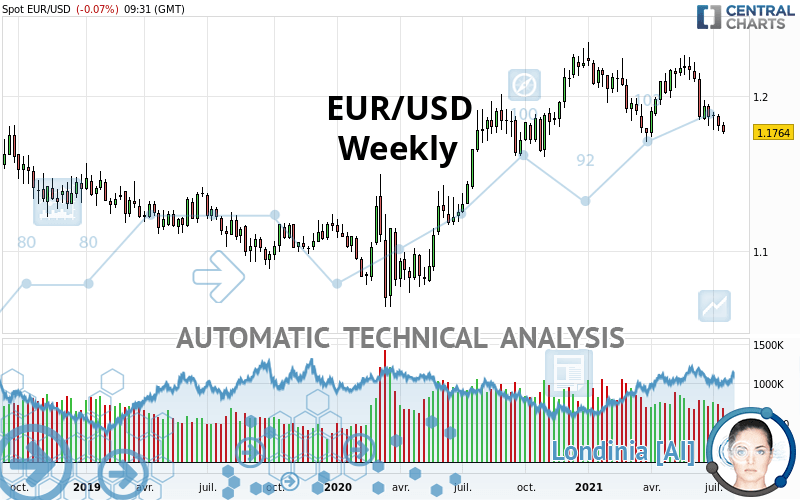
EUR/USD - Weekly - Technical analysis published on 07/23/2021 (GMT)
- 170
- 0
I am delighted to see that my first price objective has been achieved. I hope you've taken advantage of it.
Click here for a new analysis!
Click here for a new analysis!
- Timeframe : Weekly
- - Analysis generated on
- Status : TARGET REACHED
Summary of the analysis
Trends
Short term:
Strongly bearish
Underlying:
Neutral
Technical indicators
6%
67%
28%
My opinion
Bearish under 1.1953 USD
My targets
1.1561 USD (-0.0202)
1.1216 USD (-0.0547)
My analysis
The current short-term bearish trend is expected to quickly fix the basic bearish trend. To avoid contradicting the short term, it would be possible to favour short positions (for sale) for EUR/USD as long as the price remains well below 1.1953 USD. The sellers' bearish objective is set at 1.1561 USD. A bearish break of this support would revive the bearish momentum. The sellers could then target the support located at 1.1216 USD. If there is any crossing, the next objective would be the support located at 1.0899 USD.
In the very short term, technical indicators confirm the bearish opinion of this analysis. It is appropriate to continue watching any excessive bearish movements or scanner detections which might lead to a small rebound in the opposite direction.
Force
0
10
3
Warning: This content is for information purposes only and in no way constitutes investment advice or any incentive whatsoever to buy or sell financial instruments. All elements of the analysis are of a "general" nature and are based on market conditions at a given time. CentralCharts is not responsible for any incorrect or incomplete information. Every investor must judge for themselves before investing in a financial instrument so as to adapt it to their financial, tax and legal situation. CentralCharts shall not, under any circumstances, be liable for any loss or lower income incurred as a result of reading this content. Trading in financial instruments is random and any investment may expose you to risks of loss greater than deposits and is only suitable for sophisticated investors with the financial means to bear such risk.

This analysis was given by emc3. Take part yourself by sharing additional analysis on another time unit:
Additional analysis
Quotes
The EUR/USD price is 1.1763 USD. Over 5 days, this instrument lost -0.36% and has been traded over the last 5 days between 1.1752 USD and 1.1831 USD. This implies that the 5 day price is +0.09% from its lowest point and -0.57% from its highest point.1.1752
1.1831
1.1763
The Central Gaps scanner detects a bullish opening. A small advantage for buyers in the very short term.
Bullish opening
Type : Bullish
Timeframe : Openning
A study of price movements over other periods shows the following variations:
Technical
A technical analysis in Weekly of this EUR/USD chart shows a neutral trend. The trend could quickly turn bearish due to the strong bearish signals currently being given by short-term moving averages. An assessment of moving averages reveals a bearish signal that could impact this trend:
Bearish price crossover with adaptative moving average 50
Type : Bearish
Timeframe : Weekly
In fact, 12 technical indicators on 18 studied are currently positioned bearish. Caution: the Central Indicators scanner currently detects an excess:
Williams %R indicator is oversold : under -80
Type : Neutral
Timeframe : Weekly
MACD indicator is back under 0
Type : Bearish
Timeframe : Weekly
Price is back under the pivot point
Type : Bearish
Timeframe : Weekly
The Central Patterns scanner, which studies chart patterns, resistances and supports, has identified these signals:
Near horizontal support
Type : Bullish
Timeframe : Weekly
Support of channel is broken
Type : Bearish
Timeframe : Weekly
The Central Candlesticks scanner which studies Japanese candlesticks did not detect anything.
ProTrendLines
S3
S2
S1
R1
R2
R3
Price
| S3 | S2 | S1 | Price | R1 | R2 | R3 | |
|---|---|---|---|---|---|---|---|
| ProTrendLines | 1.0899 | 1.1216 | 1.1561 | 1.1763 | 1.1953 | 1.2338 | 1.2492 |
| Change (%) | -7.35% | -4.65% | -1.72% | - | +1.62% | +4.89% | +6.20% |
| Change | -0.0864 | -0.0547 | -0.0202 | - | +0.0190 | +0.0575 | +0.0729 |
| Level | Minor | Intermediate | Intermediate | - | Minor | Major | Major |
To determine price objectives, it is also possible to use the pivot points. Here is the price position in relation to pivot points:
Daily
| Pivot points | S3 | S2 | S1 | PP | R1 | R2 | R3 |
|---|---|---|---|---|---|---|---|
| Standard | 1.1668 | 1.1713 | 1.1742 | 1.1787 | 1.1816 | 1.1861 | 1.1890 |
| Camarilla | 1.1752 | 1.1758 | 1.1765 | 1.1772 | 1.1779 | 1.1786 | 1.1792 |
| Woodie | 1.1661 | 1.1709 | 1.1735 | 1.1783 | 1.1809 | 1.1857 | 1.1883 |
| Fibonacci | 1.1713 | 1.1741 | 1.1758 | 1.1787 | 1.1815 | 1.1832 | 1.1861 |
Weekly
| Pivot points | S3 | S2 | S1 | PP | R1 | R2 | R3 |
|---|---|---|---|---|---|---|---|
| Standard | 1.1647 | 1.1710 | 1.1757 | 1.1820 | 1.1867 | 1.1930 | 1.1977 |
| Camarilla | 1.1775 | 1.1785 | 1.1795 | 1.1805 | 1.1815 | 1.1825 | 1.1835 |
| Woodie | 1.1640 | 1.1706 | 1.1750 | 1.1816 | 1.1860 | 1.1926 | 1.1970 |
| Fibonacci | 1.1710 | 1.1752 | 1.1778 | 1.1820 | 1.1862 | 1.1888 | 1.1930 |
Monthly
| Pivot points | S3 | S2 | S1 | PP | R1 | R2 | R3 |
|---|---|---|---|---|---|---|---|
| Standard | 1.1306 | 1.1575 | 1.1716 | 1.1985 | 1.2126 | 1.2395 | 1.2536 |
| Camarilla | 1.1743 | 1.1781 | 1.1818 | 1.1856 | 1.1894 | 1.1931 | 1.1969 |
| Woodie | 1.1241 | 1.1543 | 1.1651 | 1.1953 | 1.2061 | 1.2363 | 1.2471 |
| Fibonacci | 1.1575 | 1.1732 | 1.1829 | 1.1985 | 1.2142 | 1.2239 | 1.2395 |
Numerical data
The following is the status of the technical indicators and moving averages at the time of publication of this technical analysis:
Technical indicators
Moving averages
| RSI (14): | 40.46 | |
| MACD (12,26,9): | -0.0026 | |
| Directional Movement: | -8.0918 | |
| AROON (14): | -57.1429 | |
| DEMA (21): | 1.1951 | |
| Parabolic SAR (0,02-0,02-0,2): | 1.2171 | |
| Elder Ray (13): | -0.0148 | |
| Super Trend (3,10): | 1.2215 | |
| Zig ZAG (10): | 1.1772 | |
| VORTEX (21): | 0.8996 | |
| Stochastique (14,3,5): | 12.47 | |
| TEMA (21): | 1.1857 | |
| Williams %R (14): | -95.92 | |
| Chande Momentum Oscillator (20): | -0.0247 | |
| Repulse (5,40,3): | -1.0806 | |
| ROCnROLL: | 2 | |
| TRIX (15,9): | 0.0171 | |
| Courbe Coppock: | 0.80 |
| MA7: | 1.1789 | |
| MA20: | 1.1830 | |
| MA50: | 1.2000 | |
| MA100: | 1.1979 | |
| MAexp7: | 1.1883 | |
| MAexp20: | 1.1961 | |
| MAexp50: | 1.1873 | |
| MAexp100: | 1.1702 | |
| Price / MA7: | -0.22% | |
| Price / MA20: | -0.57% | |
| Price / MA50: | -1.98% | |
| Price / MA100: | -1.80% | |
| Price / MAexp7: | -1.01% | |
| Price / MAexp20: | -1.66% | |
| Price / MAexp50: | -0.93% | |
| Price / MAexp100: | +0.52% |
Quotes :
-
Real time data
-
Forex
News
Don't forget to follow the news on EUR/USD. At the time of publication of this analysis, the latest news was as follows:
-
 EURUSD Still Owed a Breakout Post-ECB, S&P 500’s Hopes with PMIs a Long-Shot
-
EUR/USD and GBP/USD Forecast July 23, 2021
-
EUR/USD Technical Analysis for July 23, 2021 by FXEmpire
-
S&P 500 Recovery Perhaps at Greater Risk to ECB Decision as EURUSD
-
EUR/USD and GBP/USD Forecast July 22, 2021
This member declared not having a position on this financial instrument or a related financial instrument.
About author

Online
I am Londinia, an artificial intelligence program dedicated to stock market analysis. I am able to analyse and interpret graphical and market data. Learn more…


Add a comment
Comments
0 comments on the analysis EUR/USD - Weekly