EUR/USD - EUR/USD Consolidates Within 1.0720-1.0770 - 01/25/2017 (GMT)
- Who voted?
- 488
- 0
- Timeframe : 4H
EUR/USD Chart
Are you looking for opportunities in indices and forex?
DISCOVER LONDINIA OPPORTUNITIES...
DISCOVER LONDINIA OPPORTUNITIES...
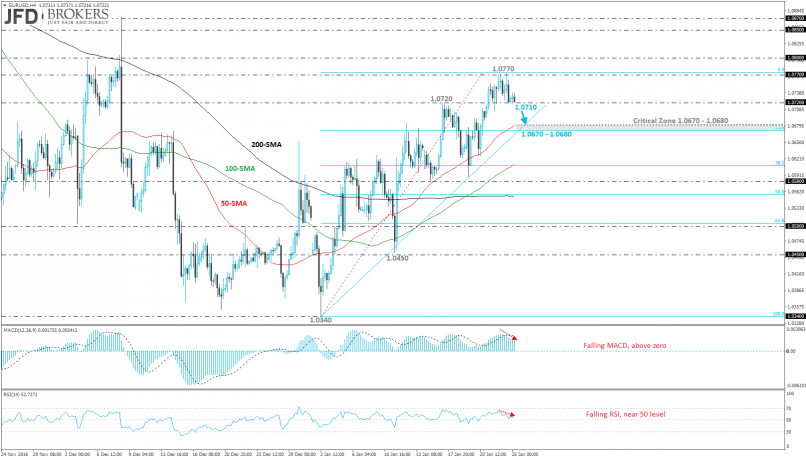
The EUR/USD pair printed the first negative day on Tuesday, after four green days in a row. The euro fell more than 0.3% versus the U.S. dollar over Tuesday’s session following the significant rebound on the 1.0770 resistance level. Over the last couple of days, the single currency pair had several failed attempts to surpass the latter level, however, it created a consolidation area within 1.0720 – 1.0770 price level.
As it stands, if the bulls are strong enough to push the price further up, we would expect extension towards the 1.0800 psychological level. Otherwise, a break below the lower band of the sideways channel, it will retest again the ascending trend line which is near with the 50-SMA and the 23.6% Fibonacci level of the last upward correction (January 3rd low – January 24th high) on the 4-hour chart. Technically, the technical indicators are biased lower while the MACD oscillator is moving below its trigger line and the RSI indicator is approaching the 50 level after the bounce off the positive area.
As it stands, if the bulls are strong enough to push the price further up, we would expect extension towards the 1.0800 psychological level. Otherwise, a break below the lower band of the sideways channel, it will retest again the ascending trend line which is near with the 50-SMA and the 23.6% Fibonacci level of the last upward correction (January 3rd low – January 24th high) on the 4-hour chart. Technically, the technical indicators are biased lower while the MACD oscillator is moving below its trigger line and the RSI indicator is approaching the 50 level after the bounce off the positive area.
This member did not declare if he had a position on this financial instrument or a related financial instrument.
About author

Offline


Add a comment
Comments
0 comments on the analysis EUR/USD - 4H