EUR/USD - Slipped Below 1.0590 Key Level - 02/21/2017 (GMT)
- Who voted?
- 395
- 0
- Timeframe : 4H
EUR/USD Chart
Are you looking for opportunities in indices and forex?
DISCOVER LONDINIA OPPORTUNITIES...
DISCOVER LONDINIA OPPORTUNITIES...
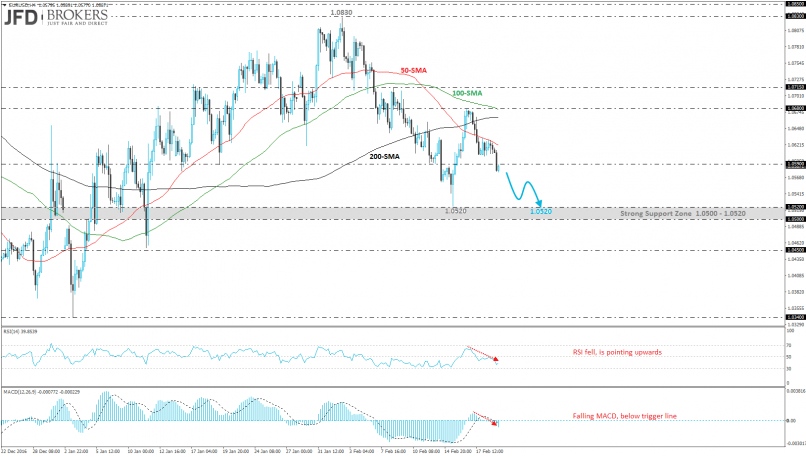
The EUR/USD pair has been trading weak since yesterday as the strength of dollar returned and got back some of its losses. The common currency pair slipped below the 50-daily SMA and the 1.0590 price level and opened the way for a retest of the 1.0520 support barrier. Traders prepare themselves for the FOMC minutes tomorrow and are driving the pair lower.
From a technical point of view, on the 4-hour chart, the technical indicators are following a negative path. The MACD oscillator is moving south with strong momentum as it fell below its trigger line. The RSI indicator rebounded on the 50 level and moved lower while now is pointing upwards.
From a technical point of view, on the 4-hour chart, the technical indicators are following a negative path. The MACD oscillator is moving south with strong momentum as it fell below its trigger line. The RSI indicator rebounded on the 50 level and moved lower while now is pointing upwards.
This member did not declare if he had a position on this financial instrument or a related financial instrument.
About author

Offline


Add a comment
Comments
0 comments on the analysis EUR/USD - 4H