EUR/USD - is Printing a Red Week After 4 Winning Sessions - 03/30/2017 (GMT)
- Who voted?
- 268
- 0
- Timeframe : Daily
EUR/USD Chart
Are you looking for opportunities in indices and forex?
DISCOVER LONDINIA OPPORTUNITIES...
DISCOVER LONDINIA OPPORTUNITIES...
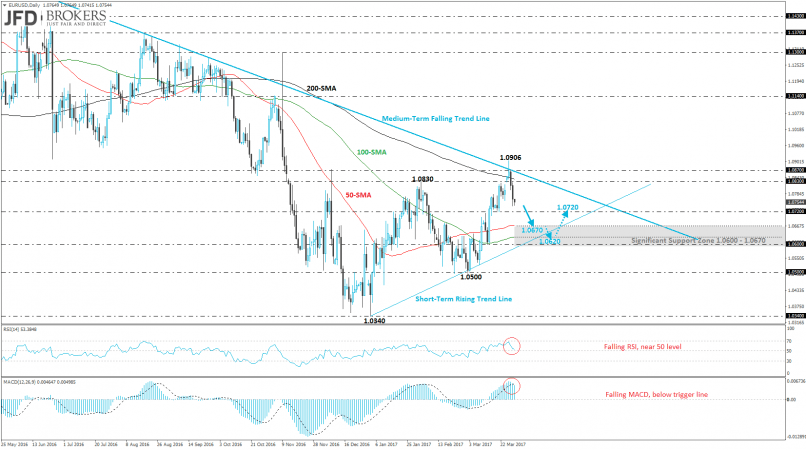
The euro remained under pressure the last two days and early this morning against the U.S. dollar as it plunged more than 1% following the strong rebound on the descending trend line. The diagonal line is holding since May 2016 and the EUR/USD pair hit it several times. The firm dollar didn't prevent the euro from pushing the pair lower. Furthermore, the price is recording the first red week after four winning periods and is approaching the 1.0720 support barrier. A break below the latter level, it would open the way for the 50 and 100 SMAs at 1.0670 and 1.0630 respectively. The short-term rising line stands since January 2017 as a correction to the upside began. The latter line acts as a strong support level and we expect a bullish move after a successful attempt.
On the daily chart, the RSI indicator rebounded on the 70 level and now is sloping downwards approaching the 50 level and the negative path. The MACD oscillator after the sharp move to the upside, it created a bearish crossover with the trigger line and lies lower in the bullish area. Technical indicators are endorsing the downward scenario as both lost its upward momentum.
On the daily chart, the RSI indicator rebounded on the 70 level and now is sloping downwards approaching the 50 level and the negative path. The MACD oscillator after the sharp move to the upside, it created a bearish crossover with the trigger line and lies lower in the bullish area. Technical indicators are endorsing the downward scenario as both lost its upward momentum.
This member did not declare if he had a position on this financial instrument or a related financial instrument.
About author

Offline


Add a comment
Comments
0 comments on the analysis EUR/USD - Daily