EUR/USD - Struggles Below 1.0600 Critical Level - Parabolic Indicates Bearish - 04/12/2017 (GMT)
- Who voted?
- 292
- 0
- Timeframe : Daily
EUR/USD Chart
Are you looking for opportunities in indices and forex?
DISCOVER LONDINIA OPPORTUNITIES...
DISCOVER LONDINIA OPPORTUNITIES...
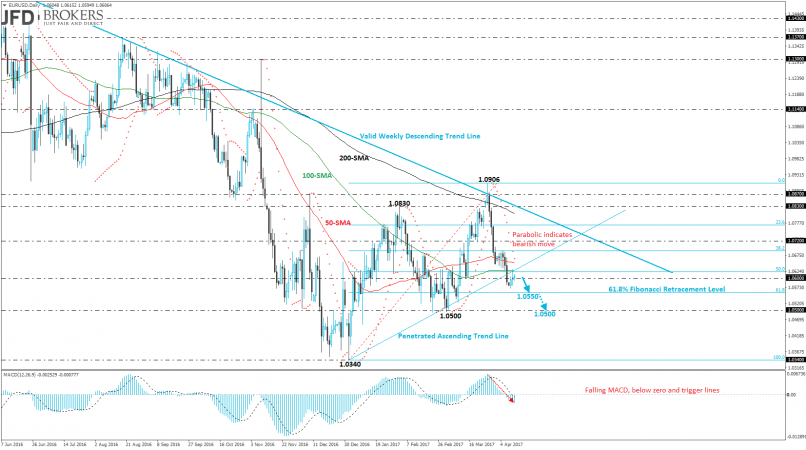
The world’s most traded currency pair completed a fairly directionless day and it ended the session near its opening price. Before that, the EUR/USD pair had a run towards the 100-daily SMA which overlaps with the 50.0% Fibonacci retracement level with low at 1.0340 and high at 1.0906. However, the pair struggles near the 1.0600 critical level which seems to be a reflection of weakness in the currency pair.
Our expectation is a further bearish movement as the price is still developing below the penetrated ascending trend line and the next level to watch is the 61.8% fibo level, near 1.0550 and the 1.0500 psychological level. Otherwise, a jump above the diagonal line will open the door for a retest of the 1.0720 resistance barrier. Technical indicators seem to be in agreement with the falling tendency. The parabolic indicator is signalling negative move while the MACD oscillator is falling and is moving in a bearish path.
Our expectation is a further bearish movement as the price is still developing below the penetrated ascending trend line and the next level to watch is the 61.8% fibo level, near 1.0550 and the 1.0500 psychological level. Otherwise, a jump above the diagonal line will open the door for a retest of the 1.0720 resistance barrier. Technical indicators seem to be in agreement with the falling tendency. The parabolic indicator is signalling negative move while the MACD oscillator is falling and is moving in a bearish path.
This member did not declare if he had a position on this financial instrument or a related financial instrument.
About author

Offline


Add a comment
Comments
0 comments on the analysis EUR/USD - Daily