EUR/USD - Reached a Six-Month High - 05/08/2017 (GMT)
- Who voted?
- 580
- 0
- Timeframe : Daily
EUR/USD Chart
Are you looking for opportunities in indices and forex?
DISCOVER LONDINIA OPPORTUNITIES...
DISCOVER LONDINIA OPPORTUNITIES...
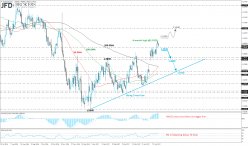
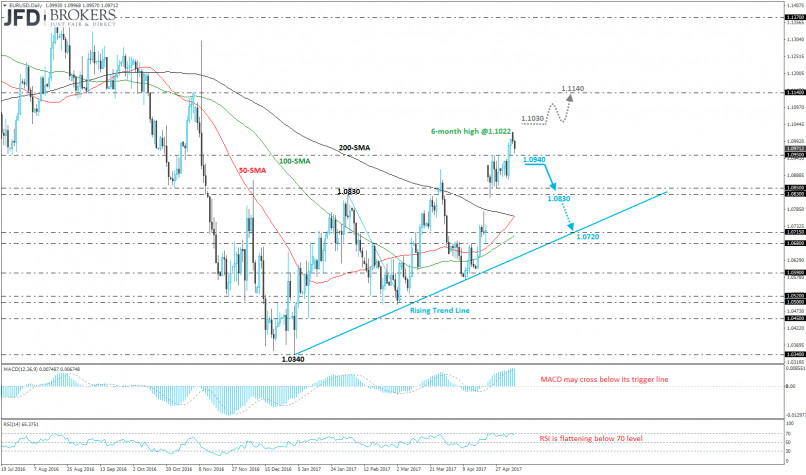
The EUR/USD has been on a rollercoaster after the French elections result in favour of Emmanuel Macron. Initially, the euro favoured from the announcement and reached a six-month high, however, afterwards it lost all its gains. It is currently finding support on the 1.0950 key level. If the price slips below the aforementioned obstacle, the next levels to watch is the zone between 1.0830 and 1.0850 and then 1.0715 near its rising trend line. Otherwise, if the 1.0950 support level holds, we will see a continuation of the uptrend.
Technical indicators are giving mixed signals. MACD is performing in the positive area but is about to cross below its trigger line on the daily chart, as it already did on the 4-hour timeframe while RSI flattened near 70 level, suggesting a retracement on the price. Contrary, 50-SMA on the daily chart is about to cross above the 200-SMA, a rising signal.
Technical indicators are giving mixed signals. MACD is performing in the positive area but is about to cross below its trigger line on the daily chart, as it already did on the 4-hour timeframe while RSI flattened near 70 level, suggesting a retracement on the price. Contrary, 50-SMA on the daily chart is about to cross above the 200-SMA, a rising signal.
This member did not declare if he had a position on this financial instrument or a related financial instrument.
About author

Offline


Add a comment
Comments
0 comments on the analysis EUR/USD - Daily