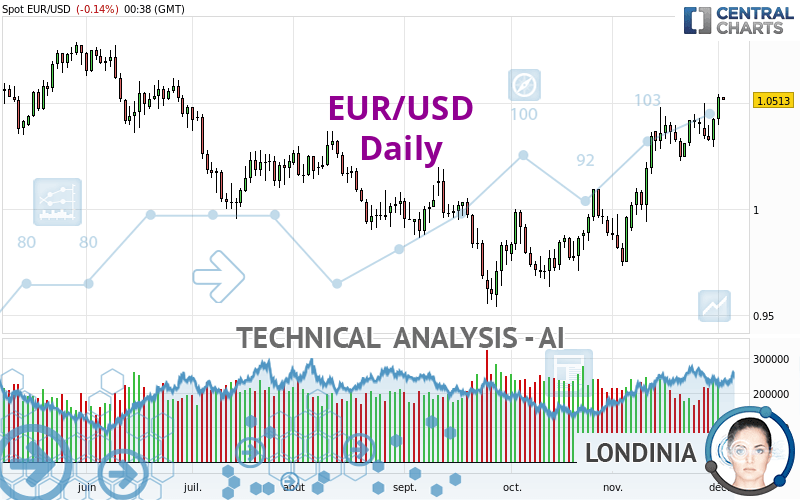
EUR/USD - Daily - Technical analysis published on 12/02/2022 (GMT)
- 150
- 0
I am delighted to see that my first price objective has been achieved. I hope you've taken advantage of it.
Click here for a new analysis!
Click here for a new analysis!
- Timeframe : Daily
- - Analysis generated on
- Status : TARGET REACHED
Summary of the analysis
Trends
Short term:
Strongly bullish
Underlying:
Strongly bullish
Technical indicators
78%
0%
22%
My opinion
Bullish above 1.0378 USD
My targets
1.0655 USD (+0.0142)
1.0774 USD (+0.0261)
My analysis
The bullish trend is currently very strong on EUR/USD. As long as the price remains above the support at 1.0378 USD, you could try to benefit from the boom. The first bullish objective is located at 1.0655 USD. The bullish momentum would be boosted by a break in this resistance. Buyers would then use the next resistance located at 1.0774 USD as an objective. Crossing it would then enable buyers to target 1.0981 USD. Be careful, given the powerful bullish rally underway, excesses could lead to a possible correction in the short term. If this is the case, remember that trading against the trend may be riskier. It would seem more appropriate to wait for a signal indicating reversal of the trend.
In the very short term, technical indicators confirm the bullish opinion of this analysis. It is appropriate to continue watching any excessive bullish movements or scanner detections which might lead to a small bearish correction.
Force
0
10
7.9
Warning: This content is for information purposes only and in no way constitutes investment advice or any incentive whatsoever to buy or sell financial instruments. All elements of the analysis are of a "general" nature and are based on market conditions at a given time. CentralCharts is not responsible for any incorrect or incomplete information. Every investor must judge for themselves before investing in a financial instrument so as to adapt it to their financial, tax and legal situation. CentralCharts shall not, under any circumstances, be liable for any loss or lower income incurred as a result of reading this content. Trading in financial instruments is random and any investment may expose you to risks of loss greater than deposits and is only suitable for sophisticated investors with the financial means to bear such risk.

This analysis was given by ASHIQ ALI. Take part yourself by sharing additional analysis on another time unit:
Additional analysis
Quotes
The EUR/USD rating is 1.0513 USD. On the day, this instrument lost -0.14% and was traded between 1.0512 USD and 1.0528 USD over the period. The price is currently at +0.01% from its lowest and -0.14% from its highest.1.0512
1.0528
1.0513
So that you have an overall view of the price change, here is a table showing the variations over several periods:
Near a new HIGH record (1 month)
Type : Bullish
Timeframe : Weekly
Technical
Technical analysis of this Daily chart of EUR/USD indicates that the overall trend is strongly bullish. 85.71% of the signals given by moving averages are bullish. The overall trend is supported by the strong bullish signals from short-term moving averages. There is no crossing of moving average by the price or crossing of moving averages between themselves.
In fact, according to the parameters integrated into the Central Analyzer system, 14 technical indicators out of 18 analysed are currently bullish. But beware of excesses. The Central Indicators scanner currently detects this:
CCI indicator is overbought : over 100
Type : Neutral
Timeframe : Daily
Williams %R indicator is overbought : over -20
Type : Neutral
Timeframe : Daily
Pivot points : price is over resistance 1
Type : Neutral
Timeframe : Weekly
An analysis of the price chart with the Central Patterns scanner (detector of chart patterns and resistances and supports) shows several results that can have an impact on the price change:
Near horizontal resistance
Type : Bearish
Timeframe : Daily
Resistance of channel is broken
Type : Bullish
Timeframe : Daily
Resistance of triangle is broken
Type : Bullish
Timeframe : Daily
The Central Candlesticks scanner which studies Japanese candlesticks did not detect anything.
ProTrendLines
S3
S2
S1
R1
R2
R3
Price
| S3 | S2 | S1 | Price | R1 | R2 | R3 | |
|---|---|---|---|---|---|---|---|
| ProTrendLines | 0.9749 | 1.0129 | 1.0378 | 1.0513 | 1.0655 | 1.0774 | 1.0981 |
| Change (%) | -7.27% | -3.65% | -1.28% | - | +1.35% | +2.48% | +4.45% |
| Change | -0.0764 | -0.0384 | -0.0135 | - | +0.0142 | +0.0261 | +0.0468 |
| Level | Minor | Major | Intermediate | - | Major | Major | Minor |
Attention could also be paid to pivot points to set price objectives:
Daily
| Pivot points | S3 | S2 | S1 | PP | R1 | R2 | R3 |
|---|---|---|---|---|---|---|---|
| Standard | 1.0287 | 1.0340 | 1.0434 | 1.0487 | 1.0581 | 1.0634 | 1.0728 |
| Camarilla | 1.0488 | 1.0501 | 1.0515 | 1.0528 | 1.0542 | 1.0555 | 1.0568 |
| Woodie | 1.0308 | 1.0350 | 1.0455 | 1.0497 | 1.0602 | 1.0644 | 1.0749 |
| Fibonacci | 1.0340 | 1.0396 | 1.0431 | 1.0487 | 1.0543 | 1.0578 | 1.0634 |
Weekly
| Pivot points | S3 | S2 | S1 | PP | R1 | R2 | R3 |
|---|---|---|---|---|---|---|---|
| Standard | 1.0038 | 1.0131 | 1.0264 | 1.0357 | 1.0490 | 1.0583 | 1.0716 |
| Camarilla | 1.0336 | 1.0357 | 1.0377 | 1.0398 | 1.0419 | 1.0439 | 1.0460 |
| Woodie | 1.0059 | 1.0141 | 1.0285 | 1.0367 | 1.0511 | 1.0593 | 1.0737 |
| Fibonacci | 1.0131 | 1.0217 | 1.0270 | 1.0357 | 1.0443 | 1.0496 | 1.0583 |
Monthly
| Pivot points | S3 | S2 | S1 | PP | R1 | R2 | R3 |
|---|---|---|---|---|---|---|---|
| Standard | 0.9169 | 0.9450 | 0.9936 | 1.0217 | 1.0703 | 1.0984 | 1.1470 |
| Camarilla | 1.0212 | 1.0282 | 1.0353 | 1.0423 | 1.0493 | 1.0564 | 1.0634 |
| Woodie | 0.9273 | 0.9501 | 1.0040 | 1.0268 | 1.0807 | 1.1035 | 1.1574 |
| Fibonacci | 0.9450 | 0.9743 | 0.9924 | 1.0217 | 1.0510 | 1.0691 | 1.0984 |
Numerical data
The following is the status of the technical indicators and moving averages at the time of publication of this technical analysis:
Technical indicators
Moving averages
| RSI (14): | 66.82 | |
| MACD (12,26,9): | 0.0127 | |
| Directional Movement: | 22.1647 | |
| AROON (14): | 57.1428 | |
| DEMA (21): | 1.0470 | |
| Parabolic SAR (0,02-0,02-0,2): | 1.0290 | |
| Elder Ray (13): | 0.0148 | |
| Super Trend (3,10): | 1.0188 | |
| Zig ZAG (10): | 1.0515 | |
| VORTEX (21): | 1.2958 | |
| Stochastique (14,3,5): | 88.72 | |
| TEMA (21): | 1.0522 | |
| Williams %R (14): | -8.20 | |
| Chande Momentum Oscillator (20): | 0.0121 | |
| Repulse (5,40,3): | 1.1177 | |
| ROCnROLL: | 1 | |
| TRIX (15,9): | 0.1809 | |
| Courbe Coppock: | 4.31 |
| MA7: | 1.0419 | |
| MA20: | 1.0316 | |
| MA50: | 1.0020 | |
| MA100: | 1.0050 | |
| MAexp7: | 1.0432 | |
| MAexp20: | 1.0305 | |
| MAexp50: | 1.0149 | |
| MAexp100: | 1.0161 | |
| Price / MA7: | +0.90% | |
| Price / MA20: | +1.91% | |
| Price / MA50: | +4.92% | |
| Price / MA100: | +4.61% | |
| Price / MAexp7: | +0.78% | |
| Price / MAexp20: | +2.02% | |
| Price / MAexp50: | +3.59% | |
| Price / MAexp100: | +3.46% |
Quotes :
-
Real time data
-
Forex
News
Don't forget to follow the news on EUR/USD. At the time of publication of this analysis, the latest news was as follows:
-
 EUR/USD Technical Analysis for December 02, 2022 by FXEmpire
-
EURUSD Reverses from 1.0500 Again as Fed and ECB Will Both Escalate Signaling
-
EUR/USD Forecast November 29, 2022
-
USD 105 Support Test, EUR/USD 1.0500 Resistance As SPX Grinds In Range
-
EUR/USD Technical Analysis for November 29, 2022 by FXEmpire
This member declared not having a position on this financial instrument or a related financial instrument.
About author

Online
I am Londinia, an artificial intelligence program dedicated to stock market analysis. I am able to analyse and interpret graphical and market data. Learn more…


Add a comment
Comments
0 comments on the analysis EUR/USD - Daily