EUR/USD - Bears Took The Lead - Our Forecast Is a Hit of 1.1285 - 07/05/2017 (GMT)
- Who voted?
- 409
- 0
- Timeframe : Daily
EUR/USD Chart
Are you looking for opportunities in indices and forex?
DISCOVER LONDINIA OPPORTUNITIES...
DISCOVER LONDINIA OPPORTUNITIES...
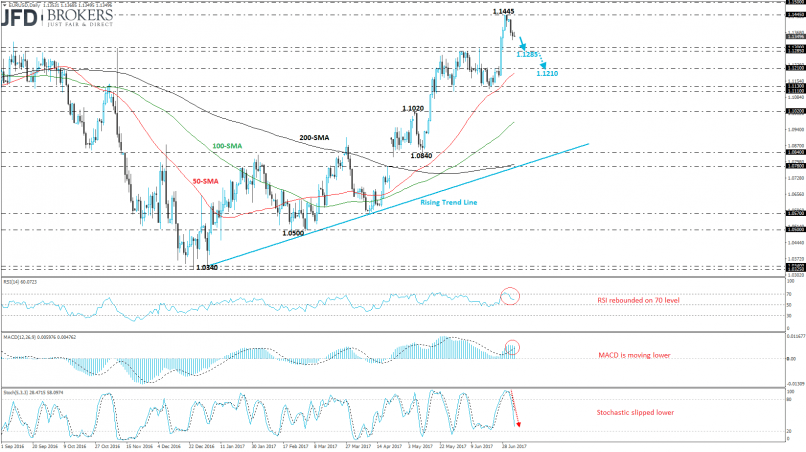
The EUR/USD pair completed the second bearish day in a row following the strong bounce off the 1.1445, 14-month high. The descending retracement started after the aggressive rising above the strong support area 1.1285 – 1.1300. Our prediction is a test of the aforementioned area and if there is a penetration beneath it will open the door for the 1.1210 barrier.
Technical indicators on the daily chart, are moving slightly lower on the positive path. The RSI indicator had a pullback from the 70 level and is sloping to the downside. Moreover, the MACD oscillator is falling but is still trading above the trigger line. The stochastic oscillator is having a bearish move and is approaching the oversold zone.
Technical indicators on the daily chart, are moving slightly lower on the positive path. The RSI indicator had a pullback from the 70 level and is sloping to the downside. Moreover, the MACD oscillator is falling but is still trading above the trigger line. The stochastic oscillator is having a bearish move and is approaching the oversold zone.
This member did not declare if he had a position on this financial instrument or a related financial instrument.
About author

Offline


Add a comment
Comments
0 comments on the analysis EUR/USD - Daily