EUR/USD - Remains Virtually Unchanged Below 1.1910 - 08/15/2017 (GMT)
- Who voted?
- 358
- 0
- Timeframe : Daily

EUR/USD Chart
Are you looking for opportunities in indices and forex?
DISCOVER LONDINIA OPPORTUNITIES...
DISCOVER LONDINIA OPPORTUNITIES...
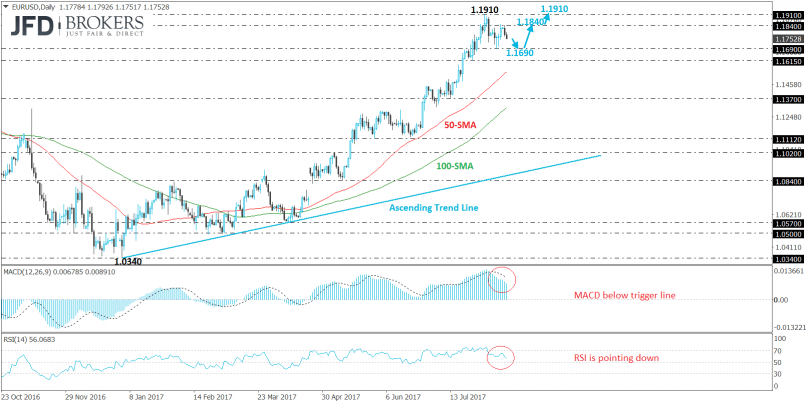
The single currency ended the week higher against the greenback despite that it had a negative behaviour at the beginning of the previous week. The EUR/USD pair posted the fifth positive week in a row and added more than 3.6% since July 9th. The next level to watch is the 1.1690 support level and then to the upside the 1.1840 and 1.1890 resistance levels. However, the price is now trading lower between the 1.1690 – 1.1840 area and we are expecting a penetration of this channel for having a clear tendency.
From a technical point of view, on the monthly chart, the price is trying to surpass the 50-SMA, which is moving near the 1.1850 price level, while the price successfully jumped above the 200-week SMA. Going to the daily timeframe, the three simple moving averages (50, 100 and 200) are sloping to the upside endorsing the thought for further upside movement. MACD and RSI seem to be confused as both are trading into the positive path with weak momentum.
From a technical point of view, on the monthly chart, the price is trying to surpass the 50-SMA, which is moving near the 1.1850 price level, while the price successfully jumped above the 200-week SMA. Going to the daily timeframe, the three simple moving averages (50, 100 and 200) are sloping to the upside endorsing the thought for further upside movement. MACD and RSI seem to be confused as both are trading into the positive path with weak momentum.
This member did not declare if he had a position on this financial instrument or a related financial instrument.
About author

Offline


Add a comment
Comments
0 comments on the analysis EUR/USD - Daily