EUR/USD - in a Narrow Range 1.1690 - 1.1840 Over the Last 3 Weeks - 08/18/2017 (GMT)
- Who voted?
- 441
- 0
- Timeframe : 4H

EUR/USD Chart
Are you looking for opportunities in indices and forex?
DISCOVER LONDINIA OPPORTUNITIES...
DISCOVER LONDINIA OPPORTUNITIES...
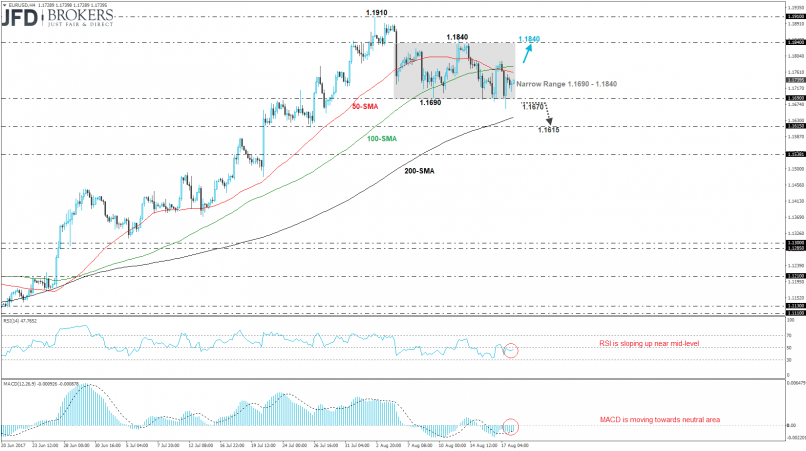
The EUR/USD is trading in sideways channel over the short-term basis as it failed several times to break the significant level at 1.1840 to the upside, as well as the 1.1690 barrier to the downside. The price remains in a non-trending mode, while on a medium-term timeframe is developing within an ascending tendency.
Currently, the pair is developing below the 50-SMA and the 100-SMA on the 4-hour chart and they posted a bearish crossover. As it stands, if the bulls are strong enough to push the price further up, we would expect extensions towards the 1.1840 barrier. A failure to retest the latter level then should prompt a move lower towards the 1.1690 strong support level again, where a battle is expected by both market forces. Relying on the short-term oscillators does not seem a solid strategy since they lie near their neutral levels. The MACD oscillator has a slightly upward momentum.
Currently, the pair is developing below the 50-SMA and the 100-SMA on the 4-hour chart and they posted a bearish crossover. As it stands, if the bulls are strong enough to push the price further up, we would expect extensions towards the 1.1840 barrier. A failure to retest the latter level then should prompt a move lower towards the 1.1690 strong support level again, where a battle is expected by both market forces. Relying on the short-term oscillators does not seem a solid strategy since they lie near their neutral levels. The MACD oscillator has a slightly upward momentum.
This member did not declare if he had a position on this financial instrument or a related financial instrument.
About author

Offline


Add a comment
Comments
0 comments on the analysis EUR/USD - 4H