EUR/USD - Penetrated the 4-Month Narrow Range and Is Moving Towards 1.1730 - 09/27/2017 (GMT)
- Who voted?
- 441
- 0
- Timeframe : Daily

EUR/USD Chart
Are you looking for opportunities in indices and forex?
DISCOVER LONDINIA OPPORTUNITIES...
DISCOVER LONDINIA OPPORTUNITIES...
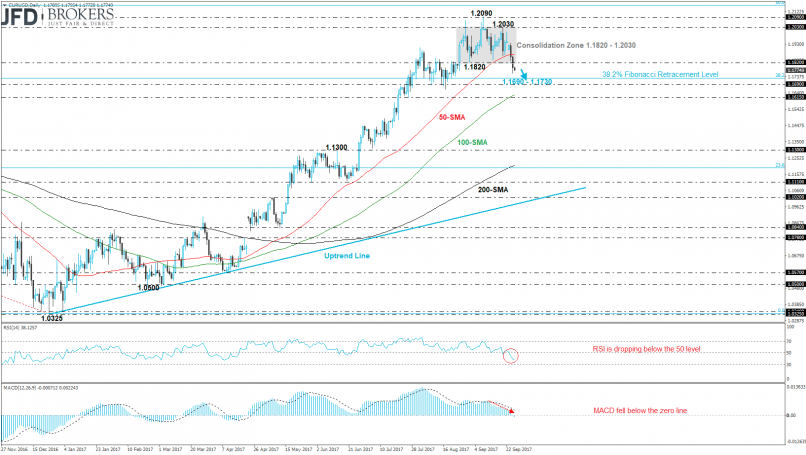
The EUR/USD pair completed a second bearish day in a row and penetrated the four-week consolidation area 1.1820 – 1.2030. The euro plummeted more than 1.5% against the U.S. dollar since Monday and could be another negative session and a potential move towards the 1.1730 support level, 38.2% Fibonacci retracement level with high at 1.4000 and low at 1.0325 (see previous technical analysis here: http://bit.ly/2wOCLSW).
Furthermore, on the daily timeframe, the price is developing well below the 50-SMA indicating for further losses. The RSI indicator fell below the 50-level with strong momentum approaching the 30 level, whilst the MACD oscillator entered into the negative territory and slipped below the trigger line. However, we do not expect the price to fall by much as buyers are likely to swoop in between 1.1690 and 1.1730.
Furthermore, on the daily timeframe, the price is developing well below the 50-SMA indicating for further losses. The RSI indicator fell below the 50-level with strong momentum approaching the 30 level, whilst the MACD oscillator entered into the negative territory and slipped below the trigger line. However, we do not expect the price to fall by much as buyers are likely to swoop in between 1.1690 and 1.1730.
This member declared not having a position on this financial instrument or a related financial instrument.
About author

Offline


Add a comment
Comments
0 comments on the analysis EUR/USD - Daily