EUR/USD - EUR/USD Plummeted for the 3rd Straight Session and Hit Our Target at 1.1730 - 09/28/2017 (GMT)
- Who voted?
- 411
- 0
- Timeframe : Daily
EUR/USD Chart
Are you looking for opportunities in indices and forex?
DISCOVER LONDINIA OPPORTUNITIES...
DISCOVER LONDINIA OPPORTUNITIES...
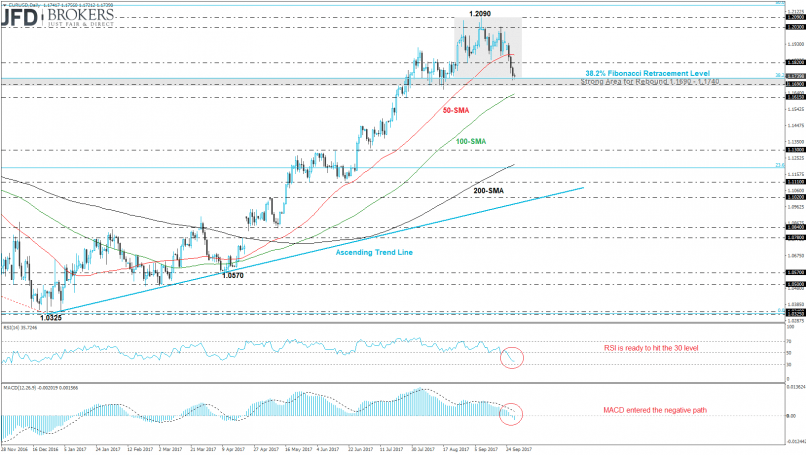
The euro completed the third bearish day in a row against the U.S. dollar, dropping more than 1.7% so far this week. The common currency pair after the penetration of the four-month trading range hit our recommended target at 1.1730 (61.8% Fibonacci retracement level) (see previous analysis here: http://bit.ly/2ys5cm1) and posted a downward correction. Moreover, the EUR/USD pair sank below the 50-day SMA indicating for further losses. The next level to watch is the 1.1690 support barrier as well as the 100-day SMA slightly above the 1.1615 support level.
Having a look on the daily timeframe, the technical indicators are confirming the recent bearish attitude as both are holding in the negative territory. The RSI indicator slipped beneath the 50 level and now is near the 30 level, whilst the MACD oscillator dropped below the zero line.
Having a look on the daily timeframe, the technical indicators are confirming the recent bearish attitude as both are holding in the negative territory. The RSI indicator slipped beneath the 50 level and now is near the 30 level, whilst the MACD oscillator dropped below the zero line.
This member declared not having a position on this financial instrument or a related financial instrument.
About author

Offline


Add a comment
Comments
0 comments on the analysis EUR/USD - Daily