EUR/USD - on Possible Downside Correction - Next Level to Watch 1.1720 - 10/17/2017 (GMT)
- Who voted?
- 499
- 0
- Timeframe : Daily
EUR/USD Chart
Are you looking for opportunities in indices and forex?
DISCOVER LONDINIA OPPORTUNITIES...
DISCOVER LONDINIA OPPORTUNITIES...
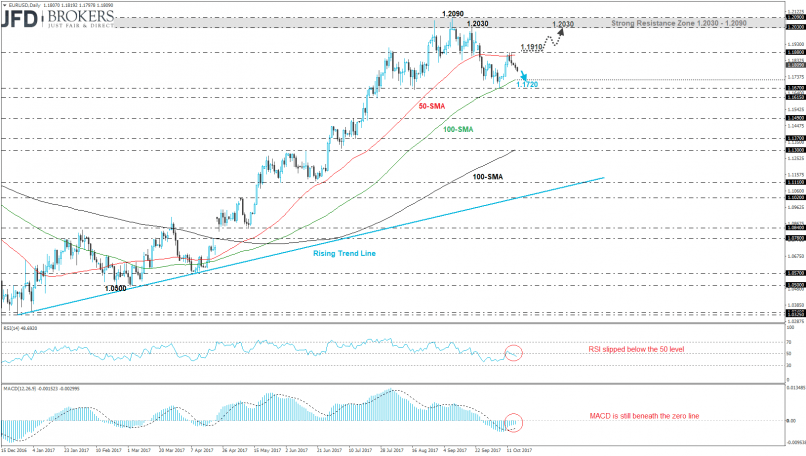
The euro was trading lower against the U.S. dollar over the previous days but finally, it posted a green week. It is worth to mention that the EUR/USD pair snapped the four consecutive losing weeks after the rebound on 1.1670 support level. The price had surged to 1.1880, which overlaps with the 50-day SMA before it started the bearish movement, and now is approaching the 100-day SMA, near 1.1720. On the other hand, if the common currency pair jumps above 1.1880, will hit the 1.2030 resistance handle.
From the technical point of view, on the medium-term timeframe, the 50-SMA is ready to create a bullish crossover with the 100-SMA, however, the technical indicators, MACD and RSI, are sloping to the downside. Going to the daily timeframe, the MACD oscillator is still holding in the bearish path, whilst the RSI indicator dropped below the 50 level.
From the technical point of view, on the medium-term timeframe, the 50-SMA is ready to create a bullish crossover with the 100-SMA, however, the technical indicators, MACD and RSI, are sloping to the downside. Going to the daily timeframe, the MACD oscillator is still holding in the bearish path, whilst the RSI indicator dropped below the 50 level.
This member declared not having a position on this financial instrument or a related financial instrument.
About author

Offline


Add a comment
Comments
0 comments on the analysis EUR/USD - Daily