EUR/USD - Is Completing a Bearish Movement With Weak Momentum - 10/18/2017 (GMT)
- Who voted?
- 456
- 0
- Timeframe : Daily

EUR/USD Chart
Are you looking for opportunities in indices and forex?
DISCOVER LONDINIA OPPORTUNITIES...
DISCOVER LONDINIA OPPORTUNITIES...
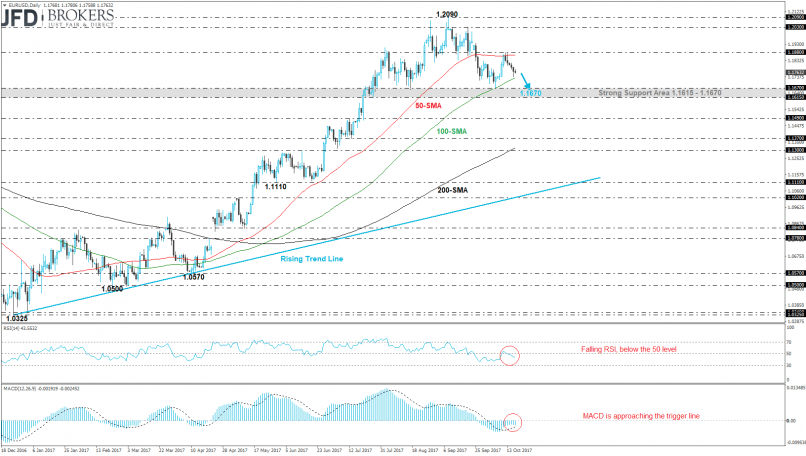
Euro headed lower versus the U.S. dollar for the fifth consecutive trading day extending its losses below the 1.1740 barrier. The EUR/USD pair almost hit the 100-day SMA and dropped 0.8% following the pullback on the 1.1880 resistance level. The next support level to have in mind is the 1.1670 strong handle if the price continues the bearish tendency and avoid the 100-day SMA obstacle. On the other hand, if the price tries to cover some bearish ground then it will meet again 1.1880.
The technical indicators, on the daily timeframe, are moving lower endorsing the scenario for descending move. The RSI indicator fell sharply below the 50 level and is developing within the negative path, whilst the MACD oscillator is approaching the trigger line and lies below the zero line.
The technical indicators, on the daily timeframe, are moving lower endorsing the scenario for descending move. The RSI indicator fell sharply below the 50 level and is developing within the negative path, whilst the MACD oscillator is approaching the trigger line and lies below the zero line.
This member declared not having a position on this financial instrument or a related financial instrument.
About author

Offline


Add a comment
Comments
0 comments on the analysis EUR/USD - Daily