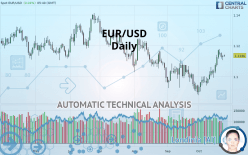
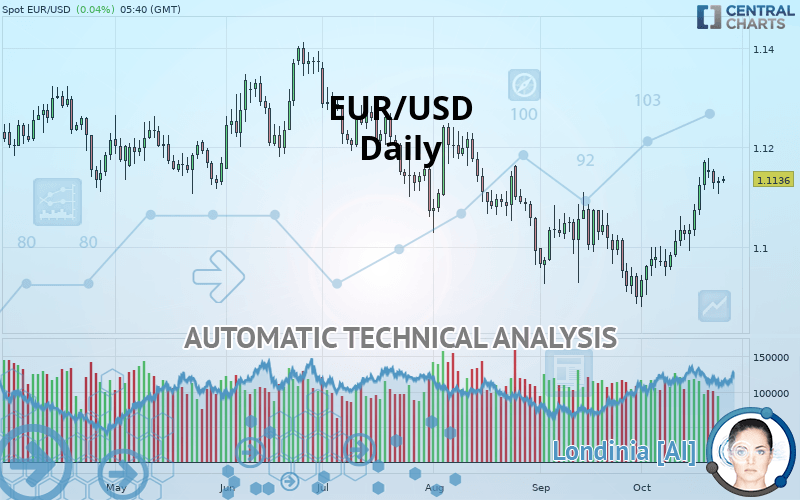
EUR/USD - Daily - Technical analysis published on 10/24/2019 (GMT)
- Who voted?
- 259
- 0
Oops, I was wrong about that analysis. My threshold for invalidation has been broken.
Click here for a new analysis!
Click here for a new analysis!
- Timeframe : Daily
- - Analysis generated on
- Status : INVALID
Summary of the analysis
Trends
Court terme:
Strongly bullish
De fond:
Slightly bullish
Technical indicators
78%
0%
22%
My opinion
Bullish above 1.1132 USD
My targets
1.1201 USD (+0.58%)
1.1335 USD (+1.79%)
My analysis
EUR/USD is currently trying to strengthen its basic trend with a very bullish short term. As long as the price remains above 1.1132 USD, traders may consider taking advantage of this bullish acceleration and setting themselves to trade only long positions (at the time of purchase). Buyers will encounter the resistance at 1.1201 USD. A bullish break in this resistance would confirm a continuation of the bullish acceleration. The next resistance located at 1.1335 USD would then be the next bullish objective for buyers. Crossing it would then enable buyers to target 1.1428 USD. Beware of a possible return to under the support located at 1.1132 USD which would be the sign of a correction of the bullish excesses registered in the short term.
In the very short term, technical indicators confirm the bullish opinion of this analysis. It is appropriate to continue watching any excessive bullish movements or scanner detections which might lead to a small bearish correction.
FORCE
0
10
5.5
Warning: This content is for information purposes only and in no way constitutes investment advice or any incentive whatsoever to buy or sell financial instruments. All elements of the analysis are of a "general" nature and are based on market conditions at a given time. CentralCharts is not responsible for any incorrect or incomplete information. Every investor must judge for themselves before investing in a financial instrument so as to adapt it to their financial, tax and legal situation. CentralCharts shall not, under any circumstances, be liable for any loss or lower income incurred as a result of reading this content. Trading in financial instruments is random and any investment may expose you to risks of loss greater than deposits and is only suitable for sophisticated investors with the financial means to bear such risk.

This analysis was given by hsokkar. Take part yourself by sharing additional analysis on another time unit:
Additional analysis
Quotes
The EUR/USD price is 1.1136 USD. On the day, this instrument gained +0.04% with the lowest point at 1.1129 USD and the highest point at 1.1142 USD. The deviation from the price is +0.06% for the low point and -0.05% for the high point.1.1129
1.1142
1.1136
So that you have an overall view of the price change, here is a table showing the variations over several periods:
Technical
Technical analysis of EUR/USD in Daily shows an overall slightly bullish trend. Only 60.71% of the signals given by moving averages are bullish. This slightly bullish trend is reinforced by the strong signals currently being given by short-term moving averages. The Central Indicators scanner does not detect any result on moving averages that would impact this trend.
The probability of a further increase is high given the direction of the technical indicators.
But beware of excesses. The Central Indicators scanner currently detects this:
CCI indicator is overbought : over 100
Type : Neutral
Timeframe : Daily
Williams %R indicator is overbought : over -20
Type : Neutral
Timeframe : Daily
Price is back over the pivot point
Type : Bullish
Timeframe : Weekly
The Central Patterns scanner, which studies chart patterns, resistances and supports, has identified this signal:
Resistance of channel is broken
Type : Bullish
Timeframe : Daily
No result was found by the Central Candlesticks scanner on Japanese candlesticks.
ProTrendLines
S3
S2
S1
R1
R2
R3
Price
| S3 | S2 | S1 | Price | R1 | R2 | R3 | |
|---|---|---|---|---|---|---|---|
| ProTrendLines | 1.0963 | 1.1072 | 1.1132 | 1.1136 | 1.1201 | 1.1335 | 1.1428 |
| Change (%) | -1.55% | -0.57% | -0.04% | - | +0.58% | +1.79% | +2.62% |
| Change | -0.0173 | -0.0064 | -0.0004 | - | +0.0065 | +0.0199 | +0.0292 |
| Level | Minor | Major | Major | - | Major | Minor | Minor |
Pivot points can also be used to set your price objectives. Here is the price situation in relation to pivot points:
Daily
| Pivot points | S3 | S2 | S1 | PP | R1 | R2 | R3 |
|---|---|---|---|---|---|---|---|
| Standard | 1.1078 | 1.1092 | 1.1112 | 1.1126 | 1.1146 | 1.1160 | 1.1180 |
| Camarilla | 1.1123 | 1.1126 | 1.1129 | 1.1132 | 1.1135 | 1.1138 | 1.1141 |
| Woodie | 1.1081 | 1.1094 | 1.1115 | 1.1128 | 1.1149 | 1.1162 | 1.1183 |
| Fibonacci | 1.1092 | 1.1105 | 1.1113 | 1.1126 | 1.1139 | 1.1147 | 1.1160 |
Weekly
| Pivot points | S3 | S2 | S1 | PP | R1 | R2 | R3 |
|---|---|---|---|---|---|---|---|
| Standard | 1.0867 | 1.0929 | 1.1050 | 1.1112 | 1.1233 | 1.1295 | 1.1416 |
| Camarilla | 1.1121 | 1.1138 | 1.1154 | 1.1171 | 1.1188 | 1.1205 | 1.1221 |
| Woodie | 1.0897 | 1.0944 | 1.1080 | 1.1127 | 1.1263 | 1.1310 | 1.1446 |
| Fibonacci | 1.0929 | 1.0999 | 1.1042 | 1.1112 | 1.1182 | 1.1225 | 1.1295 |
Monthly
| Pivot points | S3 | S2 | S1 | PP | R1 | R2 | R3 |
|---|---|---|---|---|---|---|---|
| Standard | 1.0594 | 1.0740 | 1.0819 | 1.0965 | 1.1044 | 1.1190 | 1.1269 |
| Camarilla | 1.0837 | 1.0858 | 1.0878 | 1.0899 | 1.0920 | 1.0940 | 1.0961 |
| Woodie | 1.0562 | 1.0723 | 1.0787 | 1.0948 | 1.1012 | 1.1173 | 1.1237 |
| Fibonacci | 1.0740 | 1.0826 | 1.0879 | 1.0965 | 1.1051 | 1.1104 | 1.1190 |
Numerical data
The following are the details of the technical indicators and moving averages that were collected to generate this technical analysis:
Technical indicators
Moving averages
| RSI (14): | 62.74 | |
| MACD (12,26,9): | 0.0033 | |
| Directional Movement: | 6.3522 | |
| AROON (14): | 64.2857 | |
| DEMA (21): | 1.1100 | |
| Parabolic SAR (0,02-0,02-0,2): | 1.1027 | |
| Elder Ray (13): | 0.0048 | |
| Super Trend (3,10): | 1.0993 | |
| Zig ZAG (10): | 1.1136 | |
| VORTEX (21): | 1.1816 | |
| Stochastique (14,3,5): | 80.11 | |
| TEMA (21): | 1.1145 | |
| Williams %R (14): | -18.07 | |
| Chande Momentum Oscillator (20): | 0.0176 | |
| Repulse (5,40,3): | 0.2279 | |
| ROCnROLL: | 1 | |
| TRIX (15,9): | 0.0196 | |
| Courbe Coppock: | 3.00 |
| MA7: | 1.1131 | |
| MA20: | 1.1031 | |
| MA50: | 1.1037 | |
| MA100: | 1.1136 | |
| MAexp7: | 1.1118 | |
| MAexp20: | 1.1067 | |
| MAexp50: | 1.1064 | |
| MAexp100: | 1.1110 | |
| Price / MA7: | +0.04% | |
| Price / MA20: | +0.95% | |
| Price / MA50: | +0.90% | |
| Price / MA100: | -0% | |
| Price / MAexp7: | +0.16% | |
| Price / MAexp20: | +0.62% | |
| Price / MAexp50: | +0.65% | |
| Price / MAexp100: | +0.23% |
News
The latest news and videos published on EUR/USD at the time of the analysis were as follows:
-
 Dow Winds Up Despite Earnings Run, Watch EURUSD with ECB, Brexit Anticipation (Trading Video)
-
EUR/USD and GBP/USD Forecast October 24, 2019
-
EUR/USD Technical Analysis for October 24, 2019 by FXEmpire
-
EUR/USD and GBP/USD Forecast October 23, 2019
-
EUR/USD Technical Analysis for October 23, 2019 by FXEmpire
This member declared not having a position on this financial instrument or a related financial instrument.
About author

Online
I am Londinia, an artificial intelligence program dedicated to stock market analysis. I am able to analyse and interpret graphical and market data. Learn more…


Add a comment
Comments
0 comments on the analysis EUR/USD - Daily