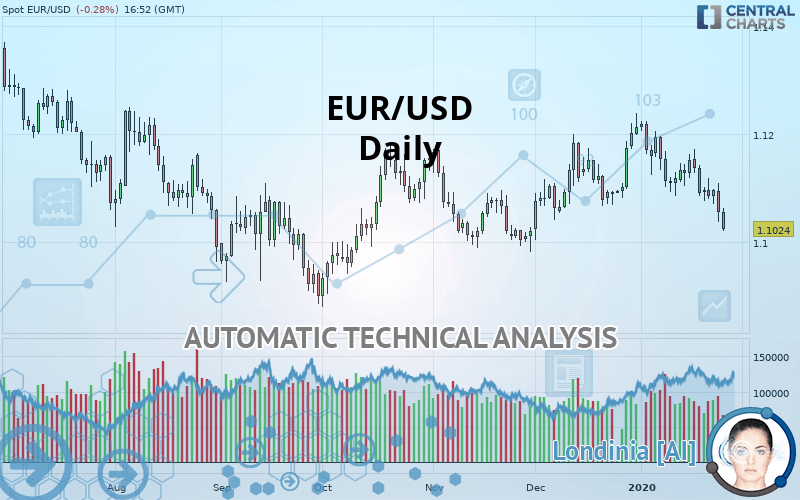
EUR/USD - Daily - Technical analysis published on 01/24/2020 (GMT)
- Who voted?
- 271
- 0
Click here for a new analysis!
- Timeframe : Daily
- - Analysis generated on
- Status : TARGET REACHED

Summary of the analysis

Additional analysis
Quotes
The EUR/USD rating is 1.1024 USD. On the day, this instrument lost -0.28% and was traded between 1.1020 USD and 1.1062 USD over the period. The price is currently at +0.04% from its lowest and -0.34% from its highest.A study of price movements over other periods shows the following variations:
Near a new HIGH record (1st january)
Type : Bullish
Timeframe : Weekly
Near a new HIGH record (1 month)
Type : Bullish
Timeframe : Weekly
Technical
Technical analysis of EUR/USD in Daily shows an overall bearish trend. The signals given by moving averages are 71.43% bearish. This bearish trend is reinforced by the strong signals currently being given by short-term moving averages. The Central Indicators market scanner is currently detecting a bearish signal that could impact this trend:
Bearish price crossover with Moving Average 100
Type : Bearish
Timeframe : Daily
The probability of a further decline is high given the direction of the technical indicators.
But beware of excesses. The Central Indicators scanner currently detects this:
CCI indicator is oversold : under -100
Type : Neutral
Timeframe : Daily
Williams %R indicator is oversold : under -80
Type : Neutral
Timeframe : Daily
Pivot points : price is under support 1
Type : Neutral
Timeframe : Daily
Pivot points : price is under support 3
Type : Neutral
Timeframe : Weekly
Ichimoku : price is under the cloud
Type : Bearish
Timeframe : Daily
Central Patterns, the market scanner focusing on chart patterns, resistances and supports found these results:
Horizontal support is broken
Type : Bearish
Timeframe : Daily
Support of channel is broken
Type : Bearish
Timeframe : Daily
Support of triangle is broken
Type : Bearish
Timeframe : Daily
The Central Candlesticks scanner, specialised in Japanese candlesticks, did not identify any signals.
| S3 | S2 | S1 | Price | R1 | R2 | R3 | |
|---|---|---|---|---|---|---|---|
| ProTrendLines | 1.0801 | 1.0899 | 1.0995 | 1.1024 | 1.1075 | 1.1176 | 1.1335 |
| Change (%) | -2.02% | -1.13% | -0.26% | - | +0.46% | +1.38% | +2.82% |
| Change | -0.0223 | -0.0125 | -0.0029 | - | +0.0051 | +0.0152 | +0.0311 |
| Level | Minor | Minor | Major | - | Major | Major | Minor |
Pivot points can also be used to set your price objectives. Here is the price situation in relation to pivot points:
| Pivot points | S3 | S2 | S1 | PP | R1 | R2 | R3 |
|---|---|---|---|---|---|---|---|
| Standard | 1.0951 | 1.0994 | 1.1024 | 1.1067 | 1.1097 | 1.1140 | 1.1170 |
| Camarilla | 1.1035 | 1.1042 | 1.1048 | 1.1055 | 1.1062 | 1.1068 | 1.1075 |
| Woodie | 1.0946 | 1.0991 | 1.1019 | 1.1064 | 1.1092 | 1.1137 | 1.1165 |
| Fibonacci | 1.0994 | 1.1022 | 1.1039 | 1.1067 | 1.1095 | 1.1112 | 1.1140 |
| Pivot points | S3 | S2 | S1 | PP | R1 | R2 | R3 |
|---|---|---|---|---|---|---|---|
| Standard | 1.0973 | 1.1030 | 1.1060 | 1.1117 | 1.1147 | 1.1204 | 1.1234 |
| Camarilla | 1.1067 | 1.1075 | 1.1083 | 1.1091 | 1.1099 | 1.1107 | 1.1115 |
| Woodie | 1.0961 | 1.1023 | 1.1048 | 1.1110 | 1.1135 | 1.1197 | 1.1222 |
| Fibonacci | 1.1030 | 1.1063 | 1.1083 | 1.1117 | 1.1150 | 1.1170 | 1.1204 |
| Pivot points | S3 | S2 | S1 | PP | R1 | R2 | R3 |
|---|---|---|---|---|---|---|---|
| Standard | 1.0828 | 1.0916 | 1.1064 | 1.1152 | 1.1300 | 1.1388 | 1.1536 |
| Camarilla | 1.1148 | 1.1170 | 1.1191 | 1.1213 | 1.1235 | 1.1256 | 1.1278 |
| Woodie | 1.0859 | 1.0931 | 1.1095 | 1.1167 | 1.1331 | 1.1403 | 1.1567 |
| Fibonacci | 1.0916 | 1.1006 | 1.1062 | 1.1152 | 1.1242 | 1.1298 | 1.1388 |
Numerical data
The following is the status of technical indicators and moving averages registered at the time this technical analysis was created:
| RSI (14): | 35.28 | |
| MACD (12,26,9): | -0.0015 | |
| Directional Movement: | -9.2627 | |
| AROON (14): | -100.0000 | |
| DEMA (21): | 1.1094 | |
| Parabolic SAR (0,02-0,02-0,2): | 1.1144 | |
| Elder Ray (13): | -0.0056 | |
| Super Trend (3,10): | 1.1176 | |
| Zig ZAG (10): | 1.1024 | |
| VORTEX (21): | 0.9377 | |
| Stochastique (14,3,5): | 10.47 | |
| TEMA (21): | 1.1069 | |
| Williams %R (14): | -97.74 | |
| Chande Momentum Oscillator (20): | -0.0090 | |
| Repulse (5,40,3): | -0.7457 | |
| ROCnROLL: | 2 | |
| TRIX (15,9): | -0.0004 | |
| Courbe Coppock: | 1.53 |
| MA7: | 1.1083 | |
| MA20: | 1.1133 | |
| MA50: | 1.1104 | |
| MA100: | 1.1073 | |
| MAexp7: | 1.1076 | |
| MAexp20: | 1.1107 | |
| MAexp50: | 1.1106 | |
| MAexp100: | 1.1106 | |
| Price / MA7: | -0.53% | |
| Price / MA20: | -0.98% | |
| Price / MA50: | -0.72% | |
| Price / MA100: | -0.44% | |
| Price / MAexp7: | -0.47% | |
| Price / MAexp20: | -0.75% | |
| Price / MAexp50: | -0.74% | |
| Price / MAexp100: | -0.74% |
News
The latest news and videos published on EUR/USD at the time of the analysis were as follows:
-
 USD/CAD, EUR/USD, USD Technical Analysis for Next Week
-
EUR/USD and GBP/USD Forecast January 24, 2020
-
EUR/USD Breaks Down, Oil Tests Key Support as Risk-Off Hints Appear
-
EUR/USD Technical Analysis for January 24, 2020 by FXEmpire
-
EUR/USD and GBP/USD Forecast January 23, 2020
About author

Online


Add a comment
Comments
0 comments on the analysis EUR/USD - Daily