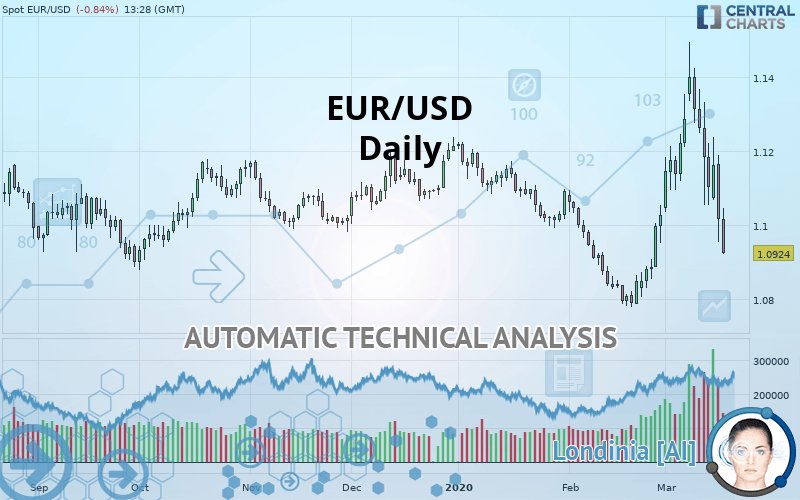
EUR/USD - Daily - Technical analysis published on 03/18/2020 (GMT)
- Who voted?
- 284
- 0
Click here for a new analysis!
- Timeframe : Daily
- - Analysis generated on
- Status : TARGET REACHED
Summary of the analysis

Additional analysis
Quotes
The EUR/USD price is 1.0924 USD. The price is lower by -0.84% since the last closing and was between 1.0921 USD and 1.1045 USD. This implies that the price is at +0.03% from its lowest and at -1.10% from its highest.A bearish opening was detected by the Central Gaps scanner. Sellers are trying to impose a bearish trend in the very short term.
Bearish opening
Type : Bearish
Timeframe : Openning
A study of price movements over other periods shows the following variations:
Abnormal volumes
Timeframe : 5 days
Technical
A technical analysis in Daily of this EUR/USD chart shows a bearish trend. 75% of the signals given by moving averages are bearish. This bearish trend is slowing down slightly given the slightly bearish signals given by short-term moving averages. An assessment of moving averages reveals several bearish signals that could impact this trend:
Bearish trend reversal : Moving Average 100
Type : Bearish
Timeframe : Daily
Bearish trend reversal : adaptative moving average 50
Type : Bearish
Timeframe : Daily
Bearish trend reversal : adaptative moving average 100
Type : Bearish
Timeframe : Daily
Bearish price crossover with Moving Average 20
Type : Bearish
Timeframe : Daily
Bearish price crossover with Moving Average 50
Type : Bearish
Timeframe : Daily
Bearish price crossover with Moving Average 100
Type : Bearish
Timeframe : Daily
Bearish price crossover with adaptative moving average 20
Type : Bearish
Timeframe : Daily
Bearish price crossover with adaptative moving average 50
Type : Bearish
Timeframe : Daily
Bearish price crossover with adaptative moving average 100
Type : Bearish
Timeframe : Daily
In fact, Central Analyzer took into account 18 technical indicators and the result was as follows: 4 are bullish, 6 are neutral and 8 are bearish. Other results related to technical indicators were also found by the Central Indicators scanner:
Pivot points : price is under support 1
Type : Neutral
Timeframe : Weekly
RSI indicator is back under 50
Type : Bearish
Timeframe : Daily
MACD crosses DOWN its Moving Average
Type : Bearish
Timeframe : Daily
Ichimoku : price is under the cloud
Type : Bearish
Timeframe : Daily
Price is back under the pivot point
Type : Bearish
Timeframe : Daily
Momentum indicator is back under 0
Type : Bearish
Timeframe : Daily
The Central Patterns scanner, which studies chart patterns, resistances and supports, has identified this signal:
Support of channel is broken
Type : Bearish
Timeframe : Daily
For a small setback in the very short term, the Central Candlesticks scanner currently notes the presence of this bearish pattern in Japanese candlesticks:
Bearish engulfing lines
Type : Bearish
Timeframe : Daily
| S3 | S2 | S1 | Price | R1 | R2 | R3 | |
|---|---|---|---|---|---|---|---|
| ProTrendLines | 1.0391 | 1.0788 | 1.0899 | 1.0924 | 1.1005 | 1.1078 | 1.1170 |
| Change (%) | -4.88% | -1.24% | -0.23% | - | +0.74% | +1.41% | +2.25% |
| Change | -0.0533 | -0.0136 | -0.0025 | - | +0.0081 | +0.0154 | +0.0246 |
| Level | Major | Minor | Major | - | Intermediate | Major | Major |
Attention could also be paid to pivot points to set price objectives:
| Pivot points | S3 | S2 | S1 | PP | R1 | R2 | R3 |
|---|---|---|---|---|---|---|---|
| Standard | 1.0684 | 1.0820 | 1.0918 | 1.1054 | 1.1152 | 1.1288 | 1.1386 |
| Camarilla | 1.0953 | 1.0974 | 1.0996 | 1.1017 | 1.1039 | 1.1060 | 1.1081 |
| Woodie | 1.0666 | 1.0811 | 1.0900 | 1.1045 | 1.1134 | 1.1279 | 1.1368 |
| Fibonacci | 1.0820 | 1.0909 | 1.0964 | 1.1054 | 1.1143 | 1.1198 | 1.1288 |
| Pivot points | S3 | S2 | S1 | PP | R1 | R2 | R3 |
|---|---|---|---|---|---|---|---|
| Standard | 1.0501 | 1.0778 | 1.0941 | 1.1218 | 1.1381 | 1.1658 | 1.1821 |
| Camarilla | 1.0983 | 1.1023 | 1.1064 | 1.1104 | 1.1144 | 1.1185 | 1.1225 |
| Woodie | 1.0444 | 1.0750 | 1.0884 | 1.1190 | 1.1324 | 1.1630 | 1.1764 |
| Fibonacci | 1.0778 | 1.0946 | 1.1050 | 1.1218 | 1.1386 | 1.1490 | 1.1658 |
| Pivot points | S3 | S2 | S1 | PP | R1 | R2 | R3 |
|---|---|---|---|---|---|---|---|
| Standard | 1.0521 | 1.0650 | 1.0838 | 1.0967 | 1.1155 | 1.1284 | 1.1472 |
| Camarilla | 1.0940 | 1.0969 | 1.0998 | 1.1027 | 1.1056 | 1.1085 | 1.1114 |
| Woodie | 1.0552 | 1.0665 | 1.0869 | 1.0982 | 1.1186 | 1.1299 | 1.1503 |
| Fibonacci | 1.0650 | 1.0771 | 1.0846 | 1.0967 | 1.1088 | 1.1163 | 1.1284 |
Numerical data
The following are the details of the technical indicators and moving averages that were collected to generate this technical analysis:
| RSI (14): | 40.70 | |
| MACD (12,26,9): | 0.0029 | |
| Directional Movement: | -2.4524 | |
| AROON (14): | 50.0000 | |
| DEMA (21): | 1.1134 | |
| Parabolic SAR (0,02-0,02-0,2): | 1.1449 | |
| Elder Ray (13): | -0.0124 | |
| Super Trend (3,10): | 1.1405 | |
| Zig ZAG (10): | 1.0928 | |
| VORTEX (21): | 1.0288 | |
| Stochastique (14,3,5): | 23.66 | |
| TEMA (21): | 1.1154 | |
| Williams %R (14): | -98.61 | |
| Chande Momentum Oscillator (20): | -0.0217 | |
| Repulse (5,40,3): | -2.4602 | |
| ROCnROLL: | 2 | |
| TRIX (15,9): | 0.0693 | |
| Courbe Coppock: | 3.50 |
| MA7: | 1.1138 | |
| MA20: | 1.1081 | |
| MA50: | 1.1037 | |
| MA100: | 1.1066 | |
| MAexp7: | 1.1091 | |
| MAexp20: | 1.1091 | |
| MAexp50: | 1.1062 | |
| MAexp100: | 1.1066 | |
| Price / MA7: | -1.92% | |
| Price / MA20: | -1.42% | |
| Price / MA50: | -1.02% | |
| Price / MA100: | -1.28% | |
| Price / MAexp7: | -1.51% | |
| Price / MAexp20: | -1.51% | |
| Price / MAexp50: | -1.25% | |
| Price / MAexp100: | -1.28% |
News
The last news published on EUR/USD at the time of the generation of this analysis was as follows:
-
 EUR/USD and GBP/USD Forecast March 18, 2020
-
US Dollar Price Action - Trade or Fade: EUR/USD, GBP/USD
-
EUR/USD Technical Analysis for March 18, 2020 by FXEmpire
-
EUR/USD and GBP/USD Forecast March 17, 2020
-
EUR/USD Technical Analysis for March 17, 2020 by FXEmpire
About author

Online


Add a comment
Comments
0 comments on the analysis EUR/USD - Daily