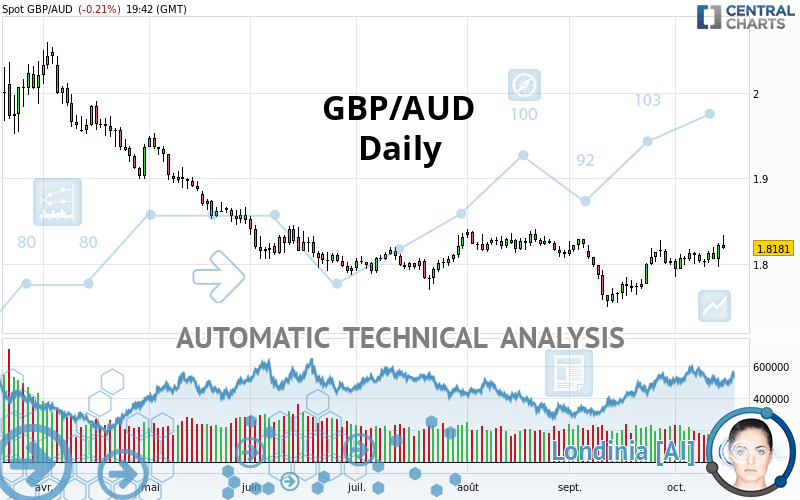
GBP/AUD - Daily - Technical analysis published on 10/15/2020 (GMT)
- Who voted?
- 144
- 0
Click here for a new analysis!
- Timeframe : Daily
- - Analysis generated on
- Status : TARGET REACHED

Summary of the analysis

Additional analysis
Quotes
The GBP/AUD price is 1.8181 AUD. On the day, this instrument lost -0.21% and was between 1.8177 AUD and 1.8333 AUD. This implies that the price is at +0.02% from its lowest and at -0.83% from its highest.The Central Gaps scanner detects a bullish opening marking the presence of buyers ahead of sellers at the opening but not sufficiently marked to allow the price to register a quotation gap.
Bullish opening
Type : Bullish
Timeframe : Openning
A study of price movements over other periods shows the following variations:
Near a new LOW record (1st january)
Type : Bearish
Timeframe : Weekly
Technical
A technical analysis in Daily of this GBP/AUD chart shows a neutral trend. The trend could quickly turn bullish due to the strong bullish signals currently being given by short-term moving averages. The Central Indicators market scanner is currently detecting several bullish signals that could impact this trend:
Bullish price crossover with Moving Average 50
Type : Bullish
Timeframe : Daily
Bullish price crossover with Moving Average 100
Type : Bullish
Timeframe : Daily
Bullish price crossover with adaptative moving average 20
Type : Bullish
Timeframe : Daily
Bullish price crossover with adaptative moving average 50
Type : Bullish
Timeframe : Daily
Bullish price crossover with adaptative moving average 100
Type : Bullish
Timeframe : Daily
Technical indicators are slightly bullish. There is therefore considerable uncertainty about the continuation of the increase.
Caution: the Central Indicators scanner currently detects an excess:
Williams %R indicator is overbought : over -20
Type : Neutral
Timeframe : Daily
Pivot points : price is under support 3
Type : Neutral
Timeframe : Weekly
RSI indicator is back over 50
Type : Bullish
Timeframe : Daily
Parabolic SAR indicator bearish reversal
Type : Bearish
Timeframe : Daily
Ichimoku : price is over the cloud
Type : Bullish
Timeframe : Daily
Price is back over the pivot point
Type : Bullish
Timeframe : Daily
Momentum indicator is back over 0
Type : Bullish
Timeframe : Daily
The Central Patterns scanner, which studies chart patterns, resistances and supports, has identified these signals:
Horizontal resistance is broken
Type : Bullish
Timeframe : Daily
Resistance of channel is broken
Type : Bullish
Timeframe : Daily
The Central Candlesticks scanner, specialised in Japanese candlesticks, did not identify any signals.
| S3 | S2 | S1 | Price | R1 | R2 | R3 | |
|---|---|---|---|---|---|---|---|
| ProTrendLines | 1.7694 | 1.7933 | 1.8153 | 1.8181 | 1.8762 | 1.9454 | 1.9734 |
| Change (%) | -2.68% | -1.36% | -0.15% | - | +3.20% | +7.00% | +8.54% |
| Change | -0.0487 | -0.0248 | -0.0028 | - | +0.0581 | +0.1273 | +0.1553 |
| Level | Major | Major | Major | - | Intermediate | Intermediate | Intermediate |
To determine price objectives, it is also possible to use the pivot points. Here is the price position in relation to pivot points:
| Pivot points | S3 | S2 | S1 | PP | R1 | R2 | R3 |
|---|---|---|---|---|---|---|---|
| Standard | 1.7758 | 1.7862 | 1.8041 | 1.8145 | 1.8324 | 1.8428 | 1.8607 |
| Camarilla | 1.8142 | 1.8168 | 1.8194 | 1.8220 | 1.8246 | 1.8272 | 1.8298 |
| Woodie | 1.7796 | 1.7881 | 1.8079 | 1.8164 | 1.8362 | 1.8447 | 1.8645 |
| Fibonacci | 1.7862 | 1.7970 | 1.8037 | 1.8145 | 1.8253 | 1.8320 | 1.8428 |
| Pivot points | S3 | S2 | S1 | PP | R1 | R2 | R3 |
|---|---|---|---|---|---|---|---|
| Standard | 2.0257 | 2.0613 | 2.0801 | 2.1157 | 2.1345 | 2.1701 | 2.1889 |
| Camarilla | 2.0838 | 2.0888 | 2.0938 | 2.0988 | 2.1038 | 2.1088 | 2.1138 |
| Woodie | 2.0172 | 2.0571 | 2.0716 | 2.1115 | 2.1260 | 2.1659 | 2.1804 |
| Fibonacci | 2.0613 | 2.0821 | 2.0950 | 2.1157 | 2.1365 | 2.1494 | 2.1701 |
| Pivot points | S3 | S2 | S1 | PP | R1 | R2 | R3 |
|---|---|---|---|---|---|---|---|
| Standard | 1.6791 | 1.7142 | 1.7585 | 1.7936 | 1.8379 | 1.8730 | 1.9173 |
| Camarilla | 1.7809 | 1.7881 | 1.7954 | 1.8027 | 1.8100 | 1.8173 | 1.8245 |
| Woodie | 1.6836 | 1.7165 | 1.7630 | 1.7959 | 1.8424 | 1.8753 | 1.9218 |
| Fibonacci | 1.7142 | 1.7446 | 1.7633 | 1.7936 | 1.8240 | 1.8427 | 1.8730 |
Numerical data
The following is the status of technical indicators and moving averages registered at the time this technical analysis was created:
| RSI (14): | 52.14 | |
| MACD (12,26,9): | 0.0062 | |
| Directional Movement: | 5.9661 | |
| AROON (14): | 50.0000 | |
| DEMA (21): | 1.8182 | |
| Parabolic SAR (0,02-0,02-0,2): | 1.8919 | |
| Elder Ray (13): | 0.0104 | |
| Super Trend (3,10): | 1.8925 | |
| Zig ZAG (10): | 1.8177 | |
| VORTEX (21): | 1.0565 | |
| Stochastique (14,3,5): | 27.86 | |
| TEMA (21): | 1.8253 | |
| Williams %R (14): | -69.27 | |
| Chande Momentum Oscillator (20): | 0.0156 | |
| Repulse (5,40,3): | 0.1149 | |
| ROCnROLL: | 1 | |
| TRIX (15,9): | 0.0351 | |
| Courbe Coppock: | 2.52 |
| MA7: | 1.8223 | |
| MA20: | 1.8087 | |
| MA50: | 1.8081 | |
| MA100: | 1.8093 | |
| MAexp7: | 1.8192 | |
| MAexp20: | 1.8114 | |
| MAexp50: | 1.8096 | |
| MAexp100: | 1.8240 | |
| Price / MA7: | -0.23% | |
| Price / MA20: | +0.52% | |
| Price / MA50: | +0.55% | |
| Price / MA100: | +0.49% | |
| Price / MAexp7: | -0.06% | |
| Price / MAexp20: | +0.37% | |
| Price / MAexp50: | +0.47% | |
| Price / MAexp100: | -0.32% |
News
The last news published on GBP/AUD at the time of the generation of this analysis was as follows:
-
 GBPAUD Clears 1.8500 Level
-
Pound Pairs Breaking Critical Levels From GBP/USD to GBP/AUD (Quick Take Video)
-
Volatility In Commodities GBP/AUD
-
Risk on pressures GBPAUD
-
Potential short-term upside for GBP/USD, GBP/AUD a longer-term play on sterling weakness
About author

Online


Add a comment
Comments
0 comments on the analysis GBP/AUD - Daily