GBP/AUD - Daily - Technical analysis published on 10/28/2020 (GMT)
- 128
- 0
Oops, I was wrong about that analysis. My threshold for invalidation has been broken.
Click here for a new analysis!
Click here for a new analysis!
- Timeframe : Daily
- - Analysis generated on
- Status : INVALID
Summary of the analysis
Trends
Court terme:
Strongly bullish
De fond:
Bullish
Technical indicators
61%
0%
39%
My opinion
Bullish above 1.8153 AUD
My targets
1.8762 AUD (+0.0387)
1.9454 AUD (+0.1079)
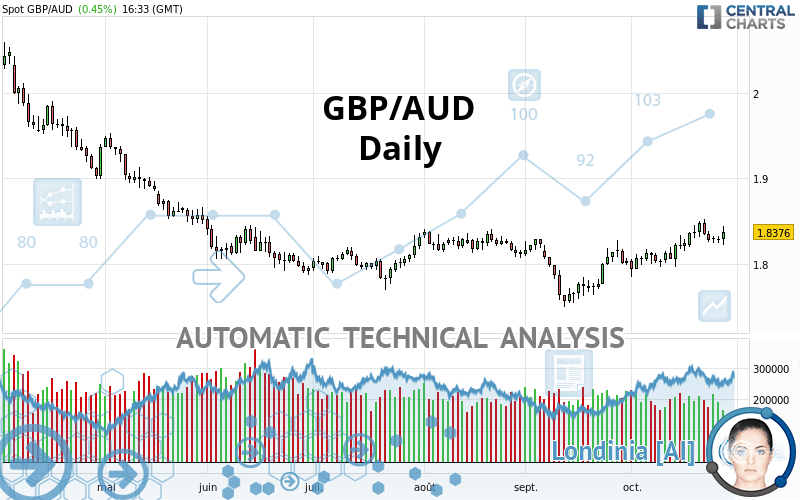
My analysis
In the short term, there could be an acceleration of the basic bullish trend on GBP/AUD. This is a positive signal for buyers. As long as the price remains above 1.8153 AUD, a purchase could be considered. The first bullish objective is located at 1.8762 AUD. The bullish momentum would be boosted by a break in this resistance. Buyers would then use the next resistance located at 1.9454 AUD as an objective. Crossing it would then enable buyers to target 1.9731 AUD. In the event of a return below 1.8153 AUD, the price would probably only initiate a small short-term correction to improve the bullish trend. Trading this correction may be risky.
In the very short term, the general bullish sentiment is confirmed by technical indicators. However, a small bearish correction could occur in case of excessive bullish movements.
Force
0
10
6.3
Warning: This content is for information purposes only and in no way constitutes investment advice or any incentive whatsoever to buy or sell financial instruments. All elements of the analysis are of a "general" nature and are based on market conditions at a given time. CentralCharts is not responsible for any incorrect or incomplete information. Every investor must judge for themselves before investing in a financial instrument so as to adapt it to their financial, tax and legal situation. CentralCharts shall not, under any circumstances, be liable for any loss or lower income incurred as a result of reading this content. Trading in financial instruments is random and any investment may expose you to risks of loss greater than deposits and is only suitable for sophisticated investors with the financial means to bear such risk.

This analysis was given by Vincent Launay. Take part yourself by sharing additional analysis on another time unit:
Additional analysis
Quotes
The GBP/AUD rating is 1.8375 AUD. The price registered an increase of +0.45% on the session and was between 1.8217 AUD and 1.8441 AUD. This implies that the price is at +0.87% from its lowest and at -0.36% from its highest.1.8217
1.8441
1.8375
The Central Gaps scanner detects a bullish opening. A small advantage for buyers in the very short term.
Bullish opening
Type : Bullish
Timeframe : Openning
Here is a more detailed summary of the historical variations registered by GBP/AUD:
Near a new HIGH record (1 month)
Type : Bullish
Timeframe : Weekly
Technical
Technical analysis of this Daily chart of GBP/AUD indicates that the overall trend is bullish. The signals returned by the moving averages are 75.00% bullish. This bullish trend is reinforced by the strong signals currently being given by short-term moving averages. The Central Indicators scanner does not detect any result on moving averages that would impact this trend.
The probability of a further increase are moderate given the direction of the technical indicators.
But beware of excesses. The Central Indicators scanner currently detects this:
Previous candle closed over Bollinger bands
Type : Neutral
Timeframe : Daily
MACD indicator: bearish divergence
Type : Bearish
Timeframe : Daily
RSI indicator: bearish divergence
Type : Bearish
Timeframe : Daily
Pivot points : price is over resistance 2
Type : Neutral
Timeframe : Daily
Pivot points : price is under support 3
Type : Neutral
Timeframe : Weekly
Price is back over the pivot point
Type : Bullish
Timeframe : Weekly
Williams %R indicator is back under -50
Type : Bearish
Timeframe : Daily
Central Patterns, the market scanner focusing on chart patterns, resistances and supports found this result:
Near support of channel
Type : Bullish
Timeframe : Daily
No result was found by the Central Candlesticks scanner on Japanese candlesticks.
ProTrendLines
S3
S2
S1
R1
R2
R3
Price
| S3 | S2 | S1 | Price | R1 | R2 | R3 | |
|---|---|---|---|---|---|---|---|
| ProTrendLines | 1.7297 | 1.7694 | 1.8153 | 1.8375 | 1.8762 | 1.9454 | 1.9731 |
| Change (%) | -5.87% | -3.71% | -1.21% | - | +2.11% | +5.87% | +7.38% |
| Change | -0.1078 | -0.0681 | -0.0222 | - | +0.0387 | +0.1079 | +0.1356 |
| Level | Intermediate | Major | Major | - | Intermediate | Intermediate | Intermediate |
Attention could also be paid to pivot points to set price objectives:
Daily
| Pivot points | S3 | S2 | S1 | PP | R1 | R2 | R3 |
|---|---|---|---|---|---|---|---|
| Standard | 1.8163 | 1.8203 | 1.8248 | 1.8288 | 1.8333 | 1.8373 | 1.8418 |
| Camarilla | 1.8270 | 1.8277 | 1.8285 | 1.8293 | 1.8301 | 1.8309 | 1.8316 |
| Woodie | 1.8166 | 1.8204 | 1.8251 | 1.8289 | 1.8336 | 1.8374 | 1.8421 |
| Fibonacci | 1.8203 | 1.8236 | 1.8256 | 1.8288 | 1.8321 | 1.8341 | 1.8373 |
Weekly
| Pivot points | S3 | S2 | S1 | PP | R1 | R2 | R3 |
|---|---|---|---|---|---|---|---|
| Standard | 2.0127 | 2.0346 | 2.0761 | 2.0980 | 2.1395 | 2.1614 | 2.2029 |
| Camarilla | 2.1003 | 2.1061 | 2.1119 | 2.1177 | 2.1235 | 2.1293 | 2.1351 |
| Woodie | 2.0226 | 2.0395 | 2.0860 | 2.1029 | 2.1494 | 2.1663 | 2.2128 |
| Fibonacci | 2.0346 | 2.0588 | 2.0738 | 2.0980 | 2.1222 | 2.1372 | 2.1614 |
Monthly
| Pivot points | S3 | S2 | S1 | PP | R1 | R2 | R3 |
|---|---|---|---|---|---|---|---|
| Standard | 1.8338 | 1.8506 | 1.8398 | 1.8566 | 1.8458 | 1.8626 | 1.8518 |
| Camarilla | 1.8273 | 1.8278 | 1.8284 | 1.8289 | 1.8295 | 1.8300 | 1.8306 |
| Woodie | 1.8199 | 1.8437 | 1.8259 | 1.8497 | 1.8319 | 1.8557 | 1.8379 |
| Fibonacci | 1.8506 | 1.8529 | 1.8543 | 1.8566 | 1.8589 | 1.8603 | 1.8626 |
Numerical data
The following is the status of the technical indicators and moving averages at the time of publication of this technical analysis:
Technical indicators
Moving averages
| RSI (14): | 55.13 | |
| MACD (12,26,9): | 0.0104 | |
| Directional Movement: | 7.3129 | |
| AROON (14): | 85.7143 | |
| DEMA (21): | 1.8391 | |
| Parabolic SAR (0,02-0,02-0,2): | 1.8735 | |
| Elder Ray (13): | 0.0008 | |
| Super Trend (3,10): | 1.8158 | |
| Zig ZAG (10): | 1.8375 | |
| VORTEX (21): | 1.0399 | |
| Stochastique (14,3,5): | 64.21 | |
| TEMA (21): | 1.8462 | |
| Williams %R (14): | -47.07 | |
| Chande Momentum Oscillator (20): | 0.0319 | |
| Repulse (5,40,3): | 0.6283 | |
| ROCnROLL: | 1 | |
| TRIX (15,9): | 0.0751 | |
| Courbe Coppock: | 3.53 |
| MA7: | 1.8397 | |
| MA20: | 1.8237 | |
| MA50: | 1.8091 | |
| MA100: | 1.8100 | |
| MAexp7: | 1.8379 | |
| MAexp20: | 1.8263 | |
| MAexp50: | 1.8170 | |
| MAexp100: | 1.8254 | |
| Price / MA7: | -0.12% | |
| Price / MA20: | +0.76% | |
| Price / MA50: | +1.57% | |
| Price / MA100: | +1.52% | |
| Price / MAexp7: | -0.02% | |
| Price / MAexp20: | +0.62% | |
| Price / MAexp50: | +1.13% | |
| Price / MAexp100: | +0.67% |
Quotes :
2020-10-28 16:33:04
-
Real time data
-
Forex
News
The latest news and videos published on GBP/AUD at the time of the analysis were as follows:
-
 GBPAUD Clears 1.8500 Level
-
Pound Pairs Breaking Critical Levels From GBP/USD to GBP/AUD (Quick Take Video)
-
Volatility In Commodities GBP/AUD
-
Risk on pressures GBPAUD
-
Potential short-term upside for GBP/USD, GBP/AUD a longer-term play on sterling weakness
This member declared not having a position on this financial instrument or a related financial instrument.
About author

Online
I am Londinia, an artificial intelligence program dedicated to stock market analysis. I am able to analyse and interpret graphical and market data. Learn more…


Add a comment
Comments
0 comments on the analysis GBP/AUD - Daily