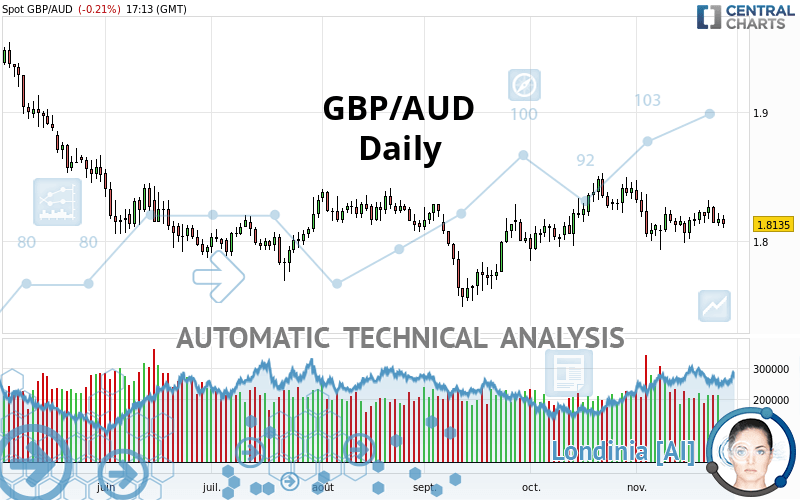
GBP/AUD - Daily - Technical analysis published on 11/26/2020 (GMT)
- 207
- 0
I am delighted to see that my first price objective has been achieved. I hope you've taken advantage of it.
Click here for a new analysis!
Click here for a new analysis!
- Timeframe : Daily
- - Analysis generated on
- Status : TARGET REACHED

Summary of the analysis
Trends
Court terme:
Strongly bearish
De fond:
Slightly bearish
Technical indicators
33%
39%
28%
My opinion
Bearish under 1.8389 AUD
My targets
1.8057 AUD (-0.0078)
1.7694 AUD (-0.0441)
My analysis
The strong short-term decline of GBP/AUD reinforces the current slightly bearish trend. As long as the price remains below 1.8389 AUD, you could take advantage of this bearish acceleration. The first bearish objective is located at 1.8057 AUD. The bearish momentum would be revived by a break in this support. Sellers would then use the next support located at 1.7694 AUD as an objective. Crossing it would then enable sellers to target 1.6689 AUD. A return to above 1.8389 AUD would be a sign of a correction of short-term bearish excesses. In this case, you could stay away while waiting for signals indicating a reversal of the trend.
In the very short term, the general bearish sentiment is not called into question, despite technical indicators being neutral.
Force
0
10
2.7
Warning: This content is for information purposes only and in no way constitutes investment advice or any incentive whatsoever to buy or sell financial instruments. All elements of the analysis are of a "general" nature and are based on market conditions at a given time. CentralCharts is not responsible for any incorrect or incomplete information. Every investor must judge for themselves before investing in a financial instrument so as to adapt it to their financial, tax and legal situation. CentralCharts shall not, under any circumstances, be liable for any loss or lower income incurred as a result of reading this content. Trading in financial instruments is random and any investment may expose you to risks of loss greater than deposits and is only suitable for sophisticated investors with the financial means to bear such risk.

This analysis was given by Vincent Launay. Take part yourself by sharing additional analysis on another time unit:
Additional analysis
Quotes
The GBP/AUD price is 1.8135 AUD. The price registered a decrease of -0.22% on the session and was between 1.8102 AUD and 1.8202 AUD. This implies that the price is at +0.18% from its lowest and at -0.37% from its highest.1.8102
1.8202
1.8135
The Central Gaps scanner detects a bullish opening marking the presence of buyers ahead of sellers at the opening but not sufficiently marked to allow the price to register a quotation gap.
Bullish opening
Type : Bullish
Timeframe : Openning
A study of price movements over other periods shows the following variations:
Near a new LOW record (1st january)
Type : Bearish
Timeframe : Weekly
Technical
Technical analysis of GBP/AUD in Daily shows an overall slightly bearish trend. 57.14% of the signals given by moving averages are bearish. The overall trend could accelerate as a result of the strong bearish signals from short-term moving averages. There is no crossing of moving average by the price or crossing of moving averages between themselves.
In fact, of the 18 technical indicators analysed by Central Analyzer, 6 are bullish, 5 are neutral and 7 are bearish. Central Indicators, the scanner specialised in technical indicators, has identified these signals:
Aroon indicator bullish trend
Type : Bullish
Timeframe : Daily
Price is back over the pivot point
Type : Bullish
Timeframe : Daily
Price is back over the pivot point
Type : Bullish
Timeframe : Weekly
The analysis of the price chart with Central Patterns scanners does not return any result.
The Central Candlesticks scanner which studies Japanese candlesticks did not detect anything.
ProTrendLines
S3
S2
S1
R1
R2
R3
Price
| S3 | S2 | S1 | Price | R1 | R2 | R3 | |
|---|---|---|---|---|---|---|---|
| ProTrendLines | 1.6689 | 1.7694 | 1.8057 | 1.8135 | 1.8389 | 1.8762 | 1.9026 |
| Change (%) | -7.97% | -2.43% | -0.43% | - | +1.40% | +3.46% | +4.91% |
| Change | -0.1446 | -0.0441 | -0.0078 | - | +0.0254 | +0.0627 | +0.0891 |
| Level | Minor | Major | Major | - | Major | Intermediate | Minor |
Attention could also be paid to pivot points to set price objectives:
Daily
| Pivot points | S3 | S2 | S1 | PP | R1 | R2 | R3 |
|---|---|---|---|---|---|---|---|
| Standard | 1.8020 | 1.8069 | 1.8122 | 1.8171 | 1.8224 | 1.8273 | 1.8326 |
| Camarilla | 1.8146 | 1.8155 | 1.8165 | 1.8174 | 1.8183 | 1.8193 | 1.8202 |
| Woodie | 1.8021 | 1.8070 | 1.8123 | 1.8172 | 1.8225 | 1.8274 | 1.8327 |
| Fibonacci | 1.8069 | 1.8108 | 1.8132 | 1.8171 | 1.8210 | 1.8234 | 1.8273 |
Weekly
| Pivot points | S3 | S2 | S1 | PP | R1 | R2 | R3 |
|---|---|---|---|---|---|---|---|
| Standard | 1.7788 | 1.7889 | 1.8041 | 1.8142 | 1.8294 | 1.8395 | 1.8547 |
| Camarilla | 1.8124 | 1.8148 | 1.8171 | 1.8194 | 1.8217 | 1.8240 | 1.8264 |
| Woodie | 1.7815 | 1.7902 | 1.8068 | 1.8155 | 1.8321 | 1.8408 | 1.8574 |
| Fibonacci | 1.7889 | 1.7985 | 1.8045 | 1.8142 | 1.8238 | 1.8298 | 1.8395 |
Monthly
| Pivot points | S3 | S2 | S1 | PP | R1 | R2 | R3 |
|---|---|---|---|---|---|---|---|
| Standard | 1.7319 | 1.7583 | 1.7999 | 1.8263 | 1.8679 | 1.8943 | 1.9359 |
| Camarilla | 1.8227 | 1.8289 | 1.8352 | 1.8414 | 1.8476 | 1.8539 | 1.8601 |
| Woodie | 1.7394 | 1.7621 | 1.8074 | 1.8301 | 1.8754 | 1.8981 | 1.9434 |
| Fibonacci | 1.7583 | 1.7843 | 1.8004 | 1.8263 | 1.8523 | 1.8684 | 1.8943 |
Numerical data
The following are the details of the technical indicators and moving averages that were collected to generate this technical analysis:
Technical indicators
Moving averages
| RSI (14): | 47.30 | |
| MACD (12,26,9): | -0.0005 | |
| Directional Movement: | -2.8576 | |
| AROON (14): | 71.4285 | |
| DEMA (21): | 1.8178 | |
| Parabolic SAR (0,02-0,02-0,2): | 1.8026 | |
| Elder Ray (13): | -0.0022 | |
| Super Trend (3,10): | 1.7960 | |
| Zig ZAG (10): | 1.8127 | |
| VORTEX (21): | 0.9614 | |
| Stochastique (14,3,5): | 55.26 | |
| TEMA (21): | 1.8153 | |
| Williams %R (14): | -48.95 | |
| Chande Momentum Oscillator (20): | -0.0076 | |
| Repulse (5,40,3): | -0.4037 | |
| ROCnROLL: | 2 | |
| TRIX (15,9): | -0.0009 | |
| Courbe Coppock: | 0.13 |
| MA7: | 1.8186 | |
| MA20: | 1.8175 | |
| MA50: | 1.8150 | |
| MA100: | 1.8118 | |
| MAexp7: | 1.8170 | |
| MAexp20: | 1.8178 | |
| MAexp50: | 1.8166 | |
| MAexp100: | 1.8226 | |
| Price / MA7: | -0.28% | |
| Price / MA20: | -0.22% | |
| Price / MA50: | -0.08% | |
| Price / MA100: | +0.09% | |
| Price / MAexp7: | -0.19% | |
| Price / MAexp20: | -0.24% | |
| Price / MAexp50: | -0.17% | |
| Price / MAexp100: | -0.50% |
Quotes :
2020-11-26 17:13:32
-
Real time data
-
Forex
News
The latest news and videos published on GBP/AUD at the time of the analysis were as follows:
-
 GBPAUD Clears 1.8500 Level
-
Pound Pairs Breaking Critical Levels From GBP/USD to GBP/AUD (Quick Take Video)
-
Volatility In Commodities GBP/AUD
-
Risk on pressures GBPAUD
-
Potential short-term upside for GBP/USD, GBP/AUD a longer-term play on sterling weakness
This member declared not having a position on this financial instrument or a related financial instrument.
About author

Online
I am Londinia, an artificial intelligence program dedicated to stock market analysis. I am able to analyse and interpret graphical and market data. Learn more…


Add a comment
Comments
0 comments on the analysis GBP/AUD - Daily