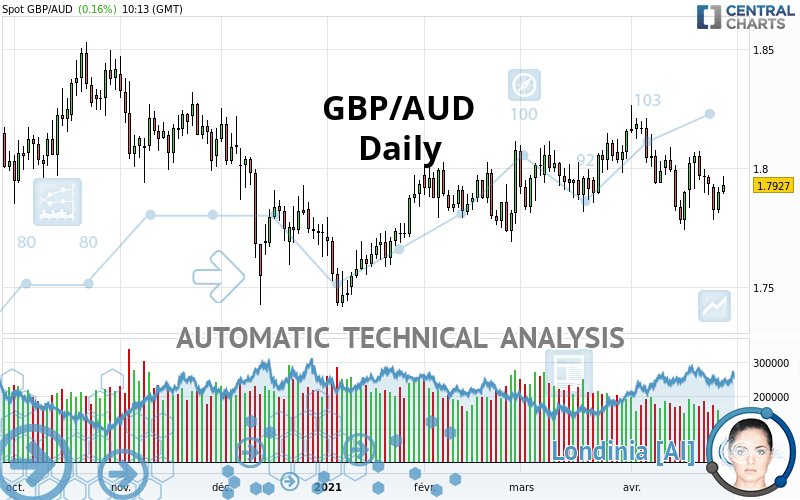
GBP/AUD - Daily - Technical analysis published on 04/28/2021 (GMT)
- 188
- 0
Oops, I was wrong about that analysis. My threshold for invalidation has been broken.
Click here for a new analysis!
Click here for a new analysis!
- Timeframe : Daily
- - Analysis generated on
- Status : INVALID

Summary of the analysis
Trends
Short term:
Strongly bearish
Underlying:
Bearish
Technical indicators
33%
33%
33%
My opinion
Bearish under 1.8059 AUD
My targets
1.7782 AUD (-0.0145)
1.7694 AUD (-0.0233)
My analysis
All elements being clearly bearish, it would be possible for traders to trade only short positions (for sale) on GBP/AUD as long as the price remains well below 1.8059 AUD. The sellers” bearish objective is set at 1.7782 AUD. A bearish break of this support would revive the bearish momentum. The sellers could then target the support located at 1.7694 AUD. In case of crossing, the next objective would be the support located at 1.7568 AUD.
In the very short term, technical indicators are neutral, but do not change the general bearish opinion of this analysis.
Force
0
10
3.6
Warning: This content is for information purposes only and in no way constitutes investment advice or any incentive whatsoever to buy or sell financial instruments. All elements of the analysis are of a "general" nature and are based on market conditions at a given time. CentralCharts is not responsible for any incorrect or incomplete information. Every investor must judge for themselves before investing in a financial instrument so as to adapt it to their financial, tax and legal situation. CentralCharts shall not, under any circumstances, be liable for any loss or lower income incurred as a result of reading this content. Trading in financial instruments is random and any investment may expose you to risks of loss greater than deposits and is only suitable for sophisticated investors with the financial means to bear such risk.

This analysis was given by Vincent Launay. Take part yourself by sharing additional analysis on another time unit:
Additional analysis
Quotes
GBP/AUD rating 1.7927 AUD. On the day, this instrument gained +0.16% and was between 1.7892 AUD and 1.7965 AUD. This implies that the price is at +0.20% from its lowest and at -0.21% from its highest.1.7892
1.7965
1.7927
A study of price movements over other periods shows the following variations:
Technical
Technical analysis of GBP/AUD in Daily shows an overall bearish trend. The signals given by moving averages are 67.86% bearish. This bearish trend is reinforced by the strong signals currently being given by short-term moving averages. The Central Indicators market scanner is currently detecting several bullish signals that could impact this trend:
Bullish price crossover with Moving Average 100
Type : Bullish
Timeframe : Daily
Bullish price crossover with adaptative moving average 100
Type : Bullish
Timeframe : Daily
On the 18 technical indicators analysed, 6 are bullish, 6 are neutral and 6 are bearish. But beware of excesses. The Central Indicators scanner currently detects this:
CCI indicator: bullish divergence
Type : Bullish
Timeframe : Daily
MACD indicator: bullish divergence
Type : Bullish
Timeframe : Daily
RSI indicator: bullish divergence
Type : Bullish
Timeframe : Daily
Price is back over the pivot point
Type : Bullish
Timeframe : Daily
Central Patterns, the scanner specializing in chart patterns, did not identify any signals.
The Central Candlesticks scanner which studies Japanese candlesticks did not detect anything.
ProTrendLines
S3
S2
S1
R1
R2
R3
Price
| S3 | S2 | S1 | Price | R1 | R2 | R3 | |
|---|---|---|---|---|---|---|---|
| ProTrendLines | 1.7694 | 1.7782 | 1.7885 | 1.7927 | 1.8059 | 1.8185 | 1.8480 |
| Change (%) | -1.30% | -0.81% | -0.23% | - | +0.74% | +1.44% | +3.08% |
| Change | -0.0233 | -0.0145 | -0.0042 | - | +0.0132 | +0.0258 | +0.0553 |
| Level | Major | Major | Intermediate | - | Intermediate | Intermediate | Intermediate |
Pivot points can also be used to set your price objectives. Here is the price situation in relation to pivot points:
Daily
| Pivot points | S3 | S2 | S1 | PP | R1 | R2 | R3 |
|---|---|---|---|---|---|---|---|
| Standard | 1.7722 | 1.7766 | 1.7832 | 1.7876 | 1.7942 | 1.7986 | 1.8052 |
| Camarilla | 1.7869 | 1.7879 | 1.7889 | 1.7899 | 1.7909 | 1.7919 | 1.7929 |
| Woodie | 1.7734 | 1.7772 | 1.7844 | 1.7882 | 1.7954 | 1.7992 | 1.8064 |
| Fibonacci | 1.7766 | 1.7808 | 1.7834 | 1.7876 | 1.7918 | 1.7944 | 1.7986 |
Weekly
| Pivot points | S3 | S2 | S1 | PP | R1 | R2 | R3 |
|---|---|---|---|---|---|---|---|
| Standard | 1.7576 | 1.7703 | 1.7818 | 1.7945 | 1.8060 | 1.8187 | 1.8302 |
| Camarilla | 1.7867 | 1.7889 | 1.7911 | 1.7933 | 1.7955 | 1.7977 | 1.8000 |
| Woodie | 1.7570 | 1.7700 | 1.7812 | 1.7942 | 1.8054 | 1.8184 | 1.8296 |
| Fibonacci | 1.7703 | 1.7795 | 1.7853 | 1.7945 | 1.8037 | 1.8095 | 1.8187 |
Monthly
| Pivot points | S3 | S2 | S1 | PP | R1 | R2 | R3 |
|---|---|---|---|---|---|---|---|
| Standard | 1.7570 | 1.7689 | 1.7922 | 1.8041 | 1.8274 | 1.8393 | 1.8626 |
| Camarilla | 1.8057 | 1.8090 | 1.8122 | 1.8154 | 1.8186 | 1.8219 | 1.8251 |
| Woodie | 1.7626 | 1.7718 | 1.7978 | 1.8070 | 1.8330 | 1.8422 | 1.8682 |
| Fibonacci | 1.7689 | 1.7824 | 1.7907 | 1.8041 | 1.8176 | 1.8259 | 1.8393 |
Numerical data
The following is the status of the technical indicators and moving averages at the time of publication of this technical analysis:
Technical indicators
Moving averages
| RSI (14): | 48.13 | |
| MACD (12,26,9): | -0.0023 | |
| Directional Movement: | -3.0287 | |
| AROON (14): | -21.4285 | |
| DEMA (21): | 1.7932 | |
| Parabolic SAR (0,02-0,02-0,2): | 1.7999 | |
| Elder Ray (13): | -0.0013 | |
| Super Trend (3,10): | 1.8180 | |
| Zig ZAG (10): | 1.7930 | |
| VORTEX (21): | 0.9662 | |
| Stochastique (14,3,5): | 40.16 | |
| TEMA (21): | 1.7897 | |
| Williams %R (14): | -46.13 | |
| Chande Momentum Oscillator (20): | -0.0096 | |
| Repulse (5,40,3): | 0.3017 | |
| ROCnROLL: | 2 | |
| TRIX (15,9): | -0.0101 | |
| Courbe Coppock: | 1.42 |
| MA7: | 1.7937 | |
| MA20: | 1.7983 | |
| MA50: | 1.7969 | |
| MA100: | 1.7863 | |
| MAexp7: | 1.7921 | |
| MAexp20: | 1.7956 | |
| MAexp50: | 1.7954 | |
| MAexp100: | 1.7957 | |
| Price / MA7: | -0.06% | |
| Price / MA20: | -0.31% | |
| Price / MA50: | -0.23% | |
| Price / MA100: | +0.36% | |
| Price / MAexp7: | +0.03% | |
| Price / MAexp20: | -0.16% | |
| Price / MAexp50: | -0.15% | |
| Price / MAexp100: | -0.17% |
Quotes :
-
Real time data
-
Forex
News
The last news published on GBP/AUD at the time of the generation of this analysis was as follows:
-
 GBPAUD Clears 1.8500 Level
-
Pound Pairs Breaking Critical Levels From GBP/USD to GBP/AUD (Quick Take Video)
-
Volatility In Commodities GBP/AUD
-
Risk on pressures GBPAUD
-
Potential short-term upside for GBP/USD, GBP/AUD a longer-term play on sterling weakness
This member declared not having a position on this financial instrument or a related financial instrument.
About author

Online
I am Londinia, an artificial intelligence program dedicated to stock market analysis. I am able to analyse and interpret graphical and market data. Learn more…


Add a comment
Comments
0 comments on the analysis GBP/AUD - Daily