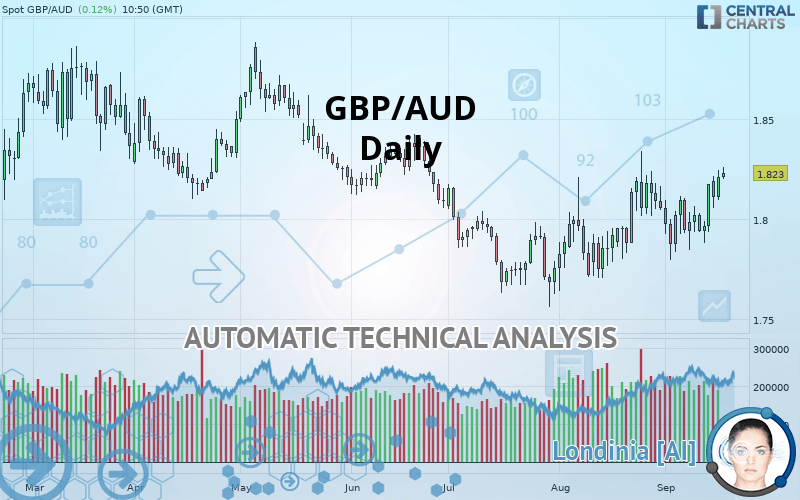
GBP/AUD - Daily - Technical analysis published on 09/18/2019 (GMT)
- Who voted?
- 211
- 0
Click here for a new analysis!
- Timeframe : Daily
- - Analysis generated on
- Status : INVALID

Summary of the analysis

Additional analysis
Quotes
The GBP/AUD rating is 1.8231 AUD. The price has increased by +0.12% since the last closing and was traded between 1.8201 AUD and 1.8260 AUD over the period. The price is currently at +0.16% from its lowest and -0.16% from its highest.A bearish opening was detected by the Central Gaps scanner. Sellers are trying to impose a bearish trend in the very short term.
Bearish opening
Type : Bearish
Timeframe : Openning
A study of price movements over other periods shows the following variations:
Technical
A technical analysis in Daily of this GBP/AUD chart shows a bullish trend. 67.86% of the signals given by moving averages are bullish. This bullish trend is supported by the strong bullish signals given by short-term moving averages. The Central Indicators scanner detects a bullish signal on moving averages that could impact this trend:
Bullish price crossover with Moving Average 100
Type : Bullish
Timeframe : Daily
The probability of a further increase is high given the direction of the technical indicators.
Caution: the Central Indicators scanner currently detects an excess:
CCI indicator is overbought : over 100
Type : Neutral
Timeframe : Daily
Williams %R indicator is overbought : over -20
Type : Neutral
Timeframe : Daily
Parabolic SAR indicator bullish reversal
Type : Bullish
Timeframe : Daily
Aroon indicator bullish trend
Type : Bullish
Timeframe : Daily
Ichimoku - Bullish crossover : Tenkan & Kijun
Type : Bullish
Timeframe : Daily
Price is back over the pivot point
Type : Bullish
Timeframe : Daily
Price is back over the pivot point
Type : Bullish
Timeframe : Weekly
An analysis of the price chart with the Central Patterns scanner (detector of chart patterns and resistances and supports) shows several results that can have an impact on the price change:
Near resistance of triangle
Type : Bearish
Timeframe : Daily
Horizontal resistance is broken
Type : Bullish
Timeframe : Daily
Resistance of channel is broken
Type : Bullish
Timeframe : Daily
The Central Candlesticks scanner, specialised in Japanese candlesticks, did not identify any signals.
| S3 | S2 | S1 | Price | R1 | R2 | R3 | |
|---|---|---|---|---|---|---|---|
| ProTrendLines | 1.7685 | 1.7885 | 1.8190 | 1.8231 | 1.8414 | 1.8760 | 1.8990 |
| Change (%) | -2.99% | -1.90% | -0.22% | - | +1.00% | +2.90% | +4.16% |
| Change | -0.0546 | -0.0346 | -0.0041 | - | +0.0183 | +0.0529 | +0.0759 |
| Level | Intermediate | Intermediate | Intermediate | - | Major | Major | Intermediate |
Pivot points can also be used to set your price objectives. Here is the price situation in relation to pivot points:
| Pivot points | S3 | S2 | S1 | PP | R1 | R2 | R3 |
|---|---|---|---|---|---|---|---|
| Standard | 1.7966 | 1.8030 | 1.8119 | 1.8183 | 1.8272 | 1.8336 | 1.8425 |
| Camarilla | 1.8167 | 1.8181 | 1.8195 | 1.8209 | 1.8223 | 1.8237 | 1.8251 |
| Woodie | 1.7980 | 1.8036 | 1.8133 | 1.8189 | 1.8286 | 1.8342 | 1.8439 |
| Fibonacci | 1.8030 | 1.8088 | 1.8124 | 1.8183 | 1.8241 | 1.8277 | 1.8336 |
| Pivot points | S3 | S2 | S1 | PP | R1 | R2 | R3 |
|---|---|---|---|---|---|---|---|
| Standard | 1.7621 | 1.7733 | 1.7952 | 1.8064 | 1.8283 | 1.8395 | 1.8614 |
| Camarilla | 1.8081 | 1.8111 | 1.8142 | 1.8172 | 1.8202 | 1.8233 | 1.8263 |
| Woodie | 1.7676 | 1.7760 | 1.8007 | 1.8091 | 1.8338 | 1.8422 | 1.8669 |
| Fibonacci | 1.7733 | 1.7859 | 1.7937 | 1.8064 | 1.8190 | 1.8268 | 1.8395 |
| Pivot points | S3 | S2 | S1 | PP | R1 | R2 | R3 |
|---|---|---|---|---|---|---|---|
| Standard | 1.6987 | 1.7313 | 1.7685 | 1.8011 | 1.8383 | 1.8709 | 1.9081 |
| Camarilla | 1.7864 | 1.7928 | 1.7992 | 1.8056 | 1.8120 | 1.8184 | 1.8248 |
| Woodie | 1.7009 | 1.7325 | 1.7707 | 1.8023 | 1.8405 | 1.8721 | 1.9103 |
| Fibonacci | 1.7313 | 1.7580 | 1.7745 | 1.8011 | 1.8278 | 1.8443 | 1.8709 |
Numerical data
The following are the details of the technical indicators and moving averages that were collected to generate this technical analysis:
| RSI (14): | 59.49 | |
| MACD (12,26,9): | 0.0052 | |
| Directional Movement: | 9.7879 | |
| AROON (14): | 78.5714 | |
| DEMA (21): | 1.8113 | |
| Parabolic SAR (0,02-0,02-0,2): | 1.7802 | |
| Elder Ray (13): | 0.0150 | |
| Super Trend (3,10): | 1.7775 | |
| Zig ZAG (10): | 1.8230 | |
| VORTEX (21): | 1.1086 | |
| Stochastique (14,3,5): | 85.53 | |
| TEMA (21): | 1.8153 | |
| Williams %R (14): | -6.42 | |
| Chande Momentum Oscillator (20): | 0.0255 | |
| Repulse (5,40,3): | 0.9883 | |
| ROCnROLL: | 1 | |
| TRIX (15,9): | 0.0290 | |
| Courbe Coppock: | 0.45 |
| MA7: | 1.8092 | |
| MA20: | 1.8068 | |
| MA50: | 1.7932 | |
| MA100: | 1.8122 | |
| MAexp7: | 1.8125 | |
| MAexp20: | 1.8052 | |
| MAexp50: | 1.8023 | |
| MAexp100: | 1.8074 | |
| Price / MA7: | +0.77% | |
| Price / MA20: | +0.90% | |
| Price / MA50: | +1.67% | |
| Price / MA100: | +0.60% | |
| Price / MAexp7: | +0.58% | |
| Price / MAexp20: | +0.99% | |
| Price / MAexp50: | +1.15% | |
| Price / MAexp100: | +0.87% |
News
The latest news and videos published on GBP/AUD at the time of the analysis were as follows:
-
 GBPAUD Clears 1.8500 Level
-
Pound Pairs Breaking Critical Levels From GBP/USD to GBP/AUD (Quick Take Video)
-
Volatility In Commodities GBP/AUD
-
Risk on pressures GBPAUD
-
Potential short-term upside for GBP/USD, GBP/AUD a longer-term play on sterling weakness
About author

Online


Add a comment
Comments
0 comments on the analysis GBP/AUD - Daily