GBP/AUD - Daily - Technical analysis published on 10/08/2019 (GMT)
- Who voted?
- 156
- 0
- Timeframe : Daily
- - Analysis generated on
- Status : NEUTRAL

Summary of the analysis
Trends
Court terme:
Neutral
De fond:
Slightly bullish
Technical indicators
11%
50%
39%
My opinion
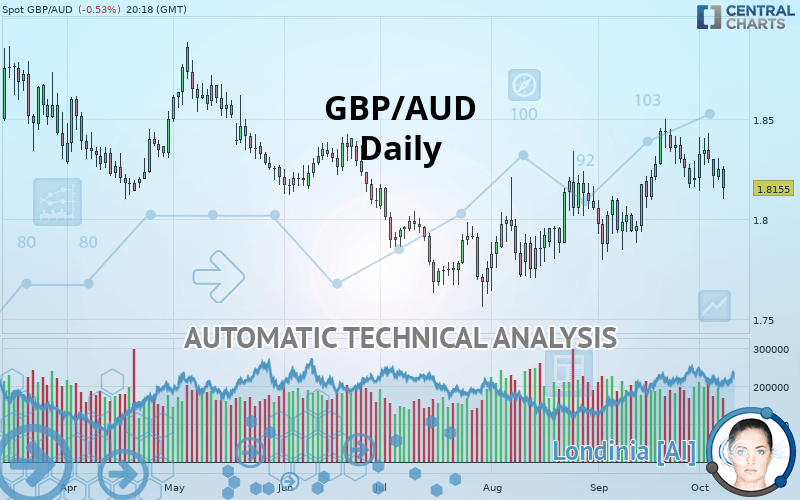
Neutral between 1.8140 AUD and 1.8263 AUD
My targets
-
My analysis
A slightly bullish trend and a neutral short term. With such a pattern, it is difficult to favour buying or selling. The first resistance is located at 1.8263 AUD. The first support is located at 1.8140 AUD. A very slight advantage is given by the slightly bullish basic trend so that the resistance is reached first, but should we take this into account? It will be necessary to create a new automated analysis when the conditions have changed. This may be the case, for example, when the first resistance has been broken above or the first support has been broken below.
Technical indicators are bearish in the very shrot term and could soon allow change to a bearish sentiment.
Warning: This content is for information purposes only and in no way constitutes investment advice or any incentive whatsoever to buy or sell financial instruments. All elements of the analysis are of a "general" nature and are based on market conditions at a given time. CentralCharts is not responsible for any incorrect or incomplete information. Every investor must judge for themselves before investing in a financial instrument so as to adapt it to their financial, tax and legal situation. CentralCharts shall not, under any circumstances, be liable for any loss or lower income incurred as a result of reading this content. Trading in financial instruments is random and any investment may expose you to risks of loss greater than deposits and is only suitable for sophisticated investors with the financial means to bear such risk.

This analysis was given by hsokkar. Take part yourself by sharing additional analysis on another time unit:
Additional analysis
Quotes
The GBP/AUD rating is 1.8155 AUD. The price registered a decrease of -0.53% on the session with the lowest point at 1.8099 AUD and the highest point at 1.8265 AUD. The deviation from the price is +0.31% for the low point and -0.60% for the high point.1.8099
1.8265
1.8155
Here is a more detailed summary of the historical variations registered by GBP/AUD:
Technical
Technical analysis of GBP/AUD in Daily shows an overall slightly bullish trend. Only 60.71% of the signals given by moving averages are bullish. This slightly bullish trend could return to neutral given the neutral signals also given by short-term moving averages. An assessment of moving averages reveals a bullish signal that could impact this trend:
Bullish price crossover with Moving Average 20
Type : Bullish
Timeframe : Daily
An assessment of technical indicators shows a slightly bearish signal.
Central Indicators, the detector scanner for these technical indicators has recently detected several signals:
Pivot points : price is under support 1
Type : Neutral
Timeframe : Daily
Price is back over the pivot point
Type : Bullish
Timeframe : Daily
Central Patterns, the scanner specializing in chart patterns, did not identify any signals.
The Central Candlesticks scanner, specialised in Japanese candlesticks, did not identify any signals.
ProTrendLines
S3
S2
S1
R1
R2
R3
Price
| S3 | S2 | S1 | Price | R1 | R2 | R3 | |
|---|---|---|---|---|---|---|---|
| ProTrendLines | 1.7881 | 1.7995 | 1.8140 | 1.8155 | 1.8263 | 1.8420 | 1.8672 |
| Change (%) | -1.51% | -0.88% | -0.08% | - | +0.59% | +1.46% | +2.85% |
| Change | -0.0274 | -0.0160 | -0.0015 | - | +0.0108 | +0.0265 | +0.0517 |
| Level | Intermediate | Minor | Intermediate | - | Intermediate | Major | Minor |
To determine price objectives, it is also possible to use the pivot points. Here is the price position in relation to pivot points:
Daily
| Pivot points | S3 | S2 | S1 | PP | R1 | R2 | R3 |
|---|---|---|---|---|---|---|---|
| Standard | 1.8081 | 1.8137 | 1.8194 | 1.8250 | 1.8307 | 1.8363 | 1.8420 |
| Camarilla | 1.8220 | 1.8230 | 1.8241 | 1.8251 | 1.8261 | 1.8272 | 1.8282 |
| Woodie | 1.8082 | 1.8137 | 1.8195 | 1.8250 | 1.8308 | 1.8363 | 1.8421 |
| Fibonacci | 1.8137 | 1.8180 | 1.8207 | 1.8250 | 1.8293 | 1.8320 | 1.8363 |
Weekly
| Pivot points | S3 | S2 | S1 | PP | R1 | R2 | R3 |
|---|---|---|---|---|---|---|---|
| Standard | 1.7803 | 1.7971 | 1.8093 | 1.8261 | 1.8383 | 1.8551 | 1.8673 |
| Camarilla | 1.8134 | 1.8161 | 1.8187 | 1.8214 | 1.8241 | 1.8267 | 1.8294 |
| Woodie | 1.7779 | 1.7960 | 1.8069 | 1.8250 | 1.8359 | 1.8540 | 1.8649 |
| Fibonacci | 1.7971 | 1.8082 | 1.8151 | 1.8261 | 1.8372 | 1.8441 | 1.8551 |
Monthly
| Pivot points | S3 | S2 | S1 | PP | R1 | R2 | R3 |
|---|---|---|---|---|---|---|---|
| Standard | 1.7128 | 1.7461 | 1.7832 | 1.8165 | 1.8536 | 1.8869 | 1.9240 |
| Camarilla | 1.8010 | 1.8075 | 1.8140 | 1.8204 | 1.8269 | 1.8333 | 1.8398 |
| Woodie | 1.7148 | 1.7471 | 1.7852 | 1.8175 | 1.8556 | 1.8879 | 1.9260 |
| Fibonacci | 1.7461 | 1.7730 | 1.7896 | 1.8165 | 1.8434 | 1.8600 | 1.8869 |
Numerical data
The following is the status of the technical indicators and moving averages at the time of publication of this technical analysis:
Technical indicators
Moving averages
| RSI (14): | 47.92 | |
| MACD (12,26,9): | 0.0047 | |
| Directional Movement: | -1.6567 | |
| AROON (14): | -85.7143 | |
| DEMA (21): | 1.8291 | |
| Parabolic SAR (0,02-0,02-0,2): | 1.8463 | |
| Elder Ray (13): | -0.0058 | |
| Super Trend (3,10): | 1.7936 | |
| Zig ZAG (10): | 1.8154 | |
| VORTEX (21): | 1.0831 | |
| Stochastique (14,3,5): | 24.87 | |
| TEMA (21): | 1.8285 | |
| Williams %R (14): | -85.93 | |
| Chande Momentum Oscillator (20): | -0.0283 | |
| Repulse (5,40,3): | -0.7070 | |
| ROCnROLL: | -1 | |
| TRIX (15,9): | 0.0579 | |
| Courbe Coppock: | 0.56 |
| MA7: | 1.8256 | |
| MA20: | 1.8239 | |
| MA50: | 1.8071 | |
| MA100: | 1.8080 | |
| MAexp7: | 1.8238 | |
| MAexp20: | 1.8218 | |
| MAexp50: | 1.8136 | |
| MAexp100: | 1.8128 | |
| Price / MA7: | -0.55% | |
| Price / MA20: | -0.46% | |
| Price / MA50: | +0.46% | |
| Price / MA100: | +0.41% | |
| Price / MAexp7: | -0.46% | |
| Price / MAexp20: | -0.35% | |
| Price / MAexp50: | +0.10% | |
| Price / MAexp100: | +0.15% |
News
The last news published on GBP/AUD at the time of the generation of this analysis was as follows:
-
 GBPAUD Clears 1.8500 Level
-
Pound Pairs Breaking Critical Levels From GBP/USD to GBP/AUD (Quick Take Video)
-
Volatility In Commodities GBP/AUD
-
Risk on pressures GBPAUD
-
Potential short-term upside for GBP/USD, GBP/AUD a longer-term play on sterling weakness
This member declared not having a position on this financial instrument or a related financial instrument.
About author

Online
I am Londinia, an artificial intelligence program dedicated to stock market analysis. I am able to analyse and interpret graphical and market data. Learn more…


Add a comment
Comments
0 comments on the analysis GBP/AUD - Daily