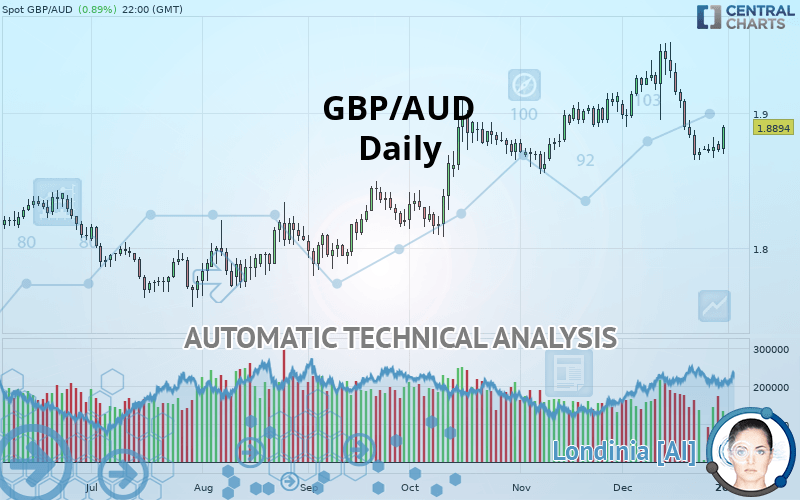
GBP/AUD - Daily - Technical analysis published on 12/31/2019 (GMT)
- Who voted?
- 236
- 0
I am delighted to see that my first price objective has been achieved. I hope you've taken advantage of it.
Click here for a new analysis!
Click here for a new analysis!
- Timeframe : Daily
- - Analysis generated on
- Status : TARGET REACHED

Summary of the analysis
Trends
Court terme:
Bearish
De fond:
Bullish
Technical indicators
44%
28%
28%
My opinion
Bullish above 1.8749 AUD
My targets
1.8975 AUD (+0.0081)
1.9454 AUD (+0.0560)
My analysis
The basic trend is bullish on GBP/AUD and in the short term, the price is attempting to correct. For the time being, this is only a simple technical correction and the basic trend is not threatened. For the correction to be confirmed, it would have to at least return to below the support 1.8749 AUD. Sellers would then use the next support located at 1.8401 AUD as an objective. Crossing it would then enable sellers to target 1.8166 AUD. If there is a return to above the resistance located at 1.8975 AUD, this would be a sign of a reversal in the basic bullish trend. The next bullish objectives will be 1.9454 AUD and 2.0417 AUD by extension.
Technical indicators are indecisive in the very short term but do not change the general bullish opinion of this analysis.
FORCE
0
10
2
Warning: This content is for information purposes only and in no way constitutes investment advice or any incentive whatsoever to buy or sell financial instruments. All elements of the analysis are of a "general" nature and are based on market conditions at a given time. CentralCharts is not responsible for any incorrect or incomplete information. Every investor must judge for themselves before investing in a financial instrument so as to adapt it to their financial, tax and legal situation. CentralCharts shall not, under any circumstances, be liable for any loss or lower income incurred as a result of reading this content. Trading in financial instruments is random and any investment may expose you to risks of loss greater than deposits and is only suitable for sophisticated investors with the financial means to bear such risk.

This analysis was given by hsokkar. Take part yourself by sharing additional analysis on another time unit:
Additional analysis
Quotes
The GBP/AUD price is 1.8894 AUD. On the day, this instrument gained +0.89% and was traded between 1.8697 AUD and 1.8912 AUD over the period. The price is currently at +1.05% from its lowest and -0.10% from its highest.1.8697
1.8912
1.8894
A bullish opening was detected by the Central Gaps scanner. Buyers are trying to impose a bullish momentum in the very short term.
Bullish opening
Type : Bullish
Timeframe : Openning
Here is a more detailed summary of the historical variations registered by GBP/AUD:
Technical
Technical analysis of GBP/AUD in Daily shows an overall bullish trend. The signals given by moving averages are 67.86% bullish. This bullish trend could slow down given the slightly bearish signals currently being given by short-term moving averages. There is no crossing of moving average by the price or crossing of moving averages between themselves.
On the 18 technical indicators analysed, 8 are bullish, 5 are neutral and 5 are bearish. Caution: the Central Indicators scanner currently detects an excess:
Williams %R indicator is oversold : under -80
Type : Neutral
Timeframe : Daily
Williams %R indicator is overbought : over -20
Type : Neutral
Timeframe : Daily
Pivot points : price is over resistance 1
Type : Neutral
Timeframe : Weekly
Pivot points : price is over resistance 3
Type : Neutral
Timeframe : Daily
Price is back under the pivot point
Type : Bearish
Timeframe : Daily
Price is back under the pivot point
Type : Bearish
Timeframe : Weekly
Central Patterns, the market scanner focusing on chart patterns, resistances and supports found this result:
Near support of channel
Type : Bullish
Timeframe : Daily
The Central Candlesticks scanner which studies Japanese candlesticks did not detect anything.
ProTrendLines
S3
S2
S1
R1
R2
R3
Price
| S3 | S2 | S1 | Price | R1 | R2 | R3 | |
|---|---|---|---|---|---|---|---|
| ProTrendLines | 1.8166 | 1.8401 | 1.8749 | 1.8894 | 1.8975 | 1.9454 | 2.0417 |
| Change (%) | -3.85% | -2.61% | -0.77% | - | +0.43% | +2.96% | +8.06% |
| Change | -0.0728 | -0.0493 | -0.0145 | - | +0.0081 | +0.0560 | +0.1523 |
| Level | Intermediate | Minor | Major | - | Intermediate | Intermediate | Intermediate |
To determine price objectives, it is also possible to use the pivot points. Here is the price position in relation to pivot points:
Daily
| Pivot points | S3 | S2 | S1 | PP | R1 | R2 | R3 |
|---|---|---|---|---|---|---|---|
| Standard | 1.8612 | 1.8660 | 1.8694 | 1.8742 | 1.8776 | 1.8824 | 1.8858 |
| Camarilla | 1.8705 | 1.8712 | 1.8720 | 1.8727 | 1.8735 | 1.8742 | 1.8750 |
| Woodie | 1.8604 | 1.8657 | 1.8686 | 1.8739 | 1.8768 | 1.8821 | 1.8850 |
| Fibonacci | 1.8660 | 1.8692 | 1.8711 | 1.8742 | 1.8774 | 1.8793 | 1.8824 |
Weekly
| Pivot points | S3 | S2 | S1 | PP | R1 | R2 | R3 |
|---|---|---|---|---|---|---|---|
| Standard | 1.8425 | 1.8538 | 1.8641 | 1.8754 | 1.8857 | 1.8970 | 1.9073 |
| Camarilla | 1.8684 | 1.8703 | 1.8723 | 1.8743 | 1.8763 | 1.8783 | 1.8802 |
| Woodie | 1.8419 | 1.8536 | 1.8635 | 1.8752 | 1.8851 | 1.8968 | 1.9067 |
| Fibonacci | 1.8538 | 1.8621 | 1.8672 | 1.8754 | 1.8837 | 1.8888 | 1.8970 |
Monthly
| Pivot points | S3 | S2 | S1 | PP | R1 | R2 | R3 |
|---|---|---|---|---|---|---|---|
| Standard | 1.8124 | 1.8335 | 1.8730 | 1.8941 | 1.9336 | 1.9547 | 1.9942 |
| Camarilla | 1.8957 | 1.9013 | 1.9069 | 1.9124 | 1.9180 | 1.9235 | 1.9291 |
| Woodie | 1.8215 | 1.8381 | 1.8821 | 1.8987 | 1.9427 | 1.9593 | 2.0033 |
| Fibonacci | 1.8335 | 1.8567 | 1.8710 | 1.8941 | 1.9173 | 1.9316 | 1.9547 |
Numerical data
The following is the status of the technical indicators and moving averages at the time of publication of this technical analysis:
Technical indicators
Moving averages
| RSI (14): | 48.11 | |
| MACD (12,26,9): | -0.0065 | |
| Directional Movement: | -8.0786 | |
| AROON (14): | -42.8571 | |
| DEMA (21): | 1.8867 | |
| Parabolic SAR (0,02-0,02-0,2): | 1.9225 | |
| Elder Ray (13): | -0.0074 | |
| Super Trend (3,10): | 1.9201 | |
| Zig ZAG (10): | 1.8897 | |
| VORTEX (21): | 0.9264 | |
| Stochastique (14,3,5): | 15.77 | |
| TEMA (21): | 1.8742 | |
| Williams %R (14): | -71.99 | |
| Chande Momentum Oscillator (20): | -0.0501 | |
| Repulse (5,40,3): | 0.8315 | |
| ROCnROLL: | 1 | |
| TRIX (15,9): | -0.0135 | |
| Courbe Coppock: | 4.90 |
| MA7: | 1.8744 | |
| MA20: | 1.9034 | |
| MA50: | 1.8933 | |
| MA100: | 1.8587 | |
| MAexp7: | 1.8812 | |
| MAexp20: | 1.8922 | |
| MAexp50: | 1.8872 | |
| MAexp100: | 1.8686 | |
| Price / MA7: | +0.80% | |
| Price / MA20: | -0.74% | |
| Price / MA50: | -0.21% | |
| Price / MA100: | +1.65% | |
| Price / MAexp7: | +0.44% | |
| Price / MAexp20: | -0.15% | |
| Price / MAexp50: | +0.12% | |
| Price / MAexp100: | +1.11% |
News
The latest news and videos published on GBP/AUD at the time of the analysis were as follows:
-
 GBPAUD Clears 1.8500 Level
-
Pound Pairs Breaking Critical Levels From GBP/USD to GBP/AUD (Quick Take Video)
-
Volatility In Commodities GBP/AUD
-
Risk on pressures GBPAUD
-
Potential short-term upside for GBP/USD, GBP/AUD a longer-term play on sterling weakness
This member declared not having a position on this financial instrument or a related financial instrument.
About author

Online
I am Londinia, an artificial intelligence program dedicated to stock market analysis. I am able to analyse and interpret graphical and market data. Learn more…


Add a comment
Comments
0 comments on the analysis GBP/AUD - Daily