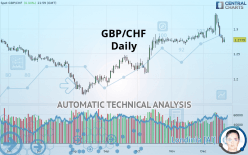
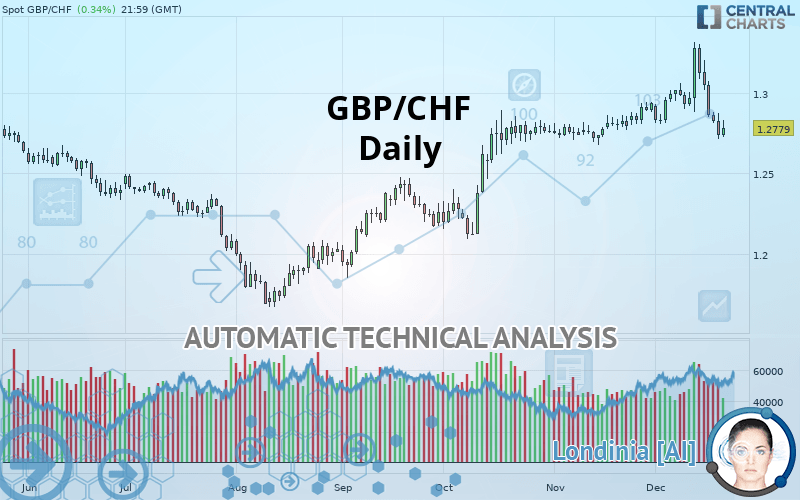
GBP/CHF - Daily - Technical analysis published on 12/22/2019 (GMT)
- Who voted?
- 218
- 0
Click here for a new analysis!
- Timeframe : Daily
- - Analysis generated on
- Status : TARGET REACHED
Summary of the analysis

Additional analysis
Quotes
The GBP/CHF price is 1.2779 CHF. The price registered an increase of +0.34% on the session with the lowest point at 1.2725 CHF and the highest point at 1.2833 CHF. The deviation from the price is +0.42% for the low point and -0.42% for the high point.The Central Gaps scanner detects a bearish opening. A small advantage for sellers in the very short term.
Bearish opening
Type : Bearish
Timeframe : Openning
So that you have an overall view of the price change, here is a table showing the variations over several periods:
Near a new HIGH record (1st january)
Type : Bullish
Timeframe : Weekly
Technical
Technical analysis of this Daily chart of GBP/CHF indicates that the overall trend is slightly bullish. 57.14% of the signals given by moving averages are bullish. Caution: a reversal of the trend could be possible given the strong bearish signals of short-term moving averages. The Central Indicators market scanner is currently detecting several bearish signals that could impact this trend:
Bearish trend reversal : Moving Average 20
Type : Bearish
Timeframe : Daily
Bearish trend reversal : adaptative moving average 50
Type : Bearish
Timeframe : Daily
Bearish price crossover with Moving Average 50
Type : Bearish
Timeframe : Daily
In fact, according to the parameters integrated into the Central Analyzer system, only 8 technical indicators out of 18 analysed are currently bearish. Caution: the Central Indicators scanner currently detects an excess:
CCI indicator is oversold : under -100
Type : Neutral
Timeframe : Daily
Williams %R indicator is oversold : under -80
Type : Neutral
Timeframe : Daily
Pivot points : price is under support 1
Type : Neutral
Timeframe : Weekly
SuperTrend indicator bearish reversal
Type : Bearish
Timeframe : Daily
Price is back over the pivot point
Type : Bullish
Timeframe : Weekly
Price is back under the pivot point
Type : Bearish
Timeframe : Daily
An analysis of the price chart with the Central Patterns scanner (detector of chart patterns and resistances and supports) shows a result that can have an impact on the price change:
Near support of channel
Type : Bullish
Timeframe : Daily
The Central Candlesticks scanner, specialised in Japanese candlesticks, did not identify any signals.
| S3 | S2 | S1 | Price | R1 | R2 | R3 | |
|---|---|---|---|---|---|---|---|
| ProTrendLines | 1.2128 | 1.2381 | 1.2629 | 1.2779 | 1.2796 | 1.2973 | 1.3157 |
| Change (%) | -5.09% | -3.11% | -1.17% | - | +0.13% | +1.52% | +2.96% |
| Change | -0.0651 | -0.0398 | -0.0150 | - | +0.0017 | +0.0194 | +0.0378 |
| Level | Intermediate | Major | Minor | - | Major | Intermediate | Major |
To determine price objectives, it is also possible to use the pivot points. Here is the price position in relation to pivot points:
| Pivot points | S3 | S2 | S1 | PP | R1 | R2 | R3 |
|---|---|---|---|---|---|---|---|
| Standard | 1.2513 | 1.2612 | 1.2674 | 1.2773 | 1.2835 | 1.2934 | 1.2996 |
| Camarilla | 1.2692 | 1.2707 | 1.2721 | 1.2736 | 1.2751 | 1.2766 | 1.2780 |
| Woodie | 1.2495 | 1.2603 | 1.2656 | 1.2764 | 1.2817 | 1.2925 | 1.2978 |
| Fibonacci | 1.2612 | 1.2674 | 1.2712 | 1.2773 | 1.2835 | 1.2873 | 1.2934 |
| Pivot points | S3 | S2 | S1 | PP | R1 | R2 | R3 |
|---|---|---|---|---|---|---|---|
| Standard | 1.2462 | 1.2670 | 1.2896 | 1.3104 | 1.3330 | 1.3538 | 1.3764 |
| Camarilla | 1.3003 | 1.3042 | 1.3082 | 1.3122 | 1.3162 | 1.3202 | 1.3241 |
| Woodie | 1.2471 | 1.2675 | 1.2905 | 1.3109 | 1.3339 | 1.3543 | 1.3773 |
| Fibonacci | 1.2670 | 1.2836 | 1.2938 | 1.3104 | 1.3270 | 1.3372 | 1.3538 |
| Pivot points | S3 | S2 | S1 | PP | R1 | R2 | R3 |
|---|---|---|---|---|---|---|---|
| Standard | 1.2489 | 1.2581 | 1.2759 | 1.2851 | 1.3029 | 1.3121 | 1.3299 |
| Camarilla | 1.2862 | 1.2887 | 1.2911 | 1.2936 | 1.2961 | 1.2986 | 1.3010 |
| Woodie | 1.2531 | 1.2603 | 1.2801 | 1.2873 | 1.3071 | 1.3143 | 1.3341 |
| Fibonacci | 1.2581 | 1.2685 | 1.2748 | 1.2851 | 1.2955 | 1.3018 | 1.3121 |
Numerical data
The following is the status of the technical indicators and moving averages at the time of publication of this technical analysis:
| RSI (14): | 44.69 | |
| MACD (12,26,9): | 0.0021 | |
| Directional Movement: | -1.9282 | |
| AROON (14): | -35.7142 | |
| DEMA (21): | 1.2946 | |
| Parabolic SAR (0,02-0,02-0,2): | 1.3213 | |
| Elder Ray (13): | -0.0126 | |
| Super Trend (3,10): | 1.3189 | |
| Zig ZAG (10): | 1.2779 | |
| VORTEX (21): | 0.9743 | |
| Stochastique (14,3,5): | 6.47 | |
| TEMA (21): | 1.2895 | |
| Williams %R (14): | -88.69 | |
| Chande Momentum Oscillator (20): | -0.0177 | |
| Repulse (5,40,3): | -1.3307 | |
| ROCnROLL: | -1 | |
| TRIX (15,9): | 0.0663 | |
| Courbe Coppock: | 0.33 |
| MA7: | 1.2949 | |
| MA20: | 1.2929 | |
| MA50: | 1.2828 | |
| MA100: | 1.2468 | |
| MAexp7: | 1.2872 | |
| MAexp20: | 1.2899 | |
| MAexp50: | 1.2784 | |
| MAexp100: | 1.2656 | |
| Price / MA7: | -1.31% | |
| Price / MA20: | -1.16% | |
| Price / MA50: | -0.38% | |
| Price / MA100: | +2.49% | |
| Price / MAexp7: | -0.72% | |
| Price / MAexp20: | -0.93% | |
| Price / MAexp50: | -0.04% | |
| Price / MAexp100: | +0.97% |
News
The last news published on GBP/CHF at the time of the generation of this analysis was as follows:
-
 Weekly Technical Analysis: 23/07/2019 - USDJPY, GBPCHF, NZDUSD
-
GBP/CHF Is a Preferred Setup Because of its Lack of Key Events (Quick Take Video)
About author

Online


Add a comment
Comments
0 comments on the analysis GBP/CHF - Daily