NIKKEI225 $ FULL0624 - Daily - Technical analysis published on 05/18/2022 (GMT)
- 159
- 0
Click here for a new analysis!
- Timeframe : Daily
- - Analysis generated on
- Status : INVALID
Summary of the analysis

Additional analysis
Quotes
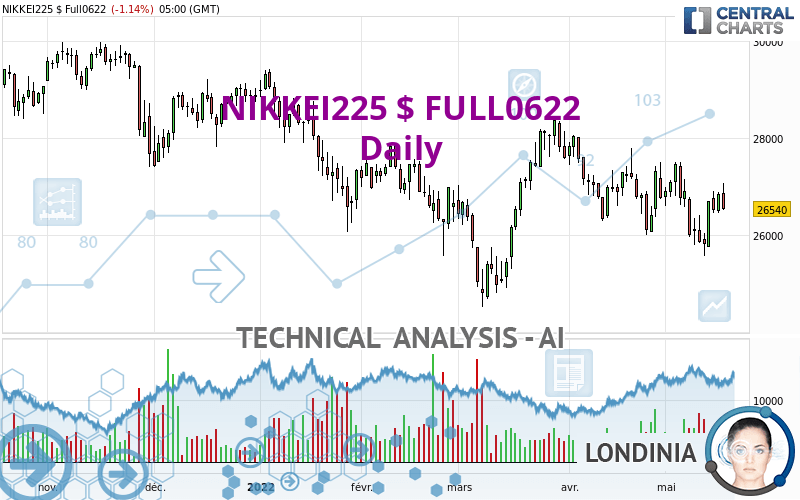
NIKKEI225 $ FULL0622 rating 26,540 USD. The price is lower by -1.14% since the last closing and was between 26,515 USD and 27,075 USD. This implies that the price is at +0.09% from its lowest and at -1.98% from its highest.The Central Gaps scanner detects a bullish opening. A small advantage for buyers in the very short term.
Bullish opening
Type : Bullish
Timeframe : Openning
A study of price movements over other periods shows the following variations:
Near a new LOW record (1 month)
Type : Bearish
Timeframe : Weekly
Technical
Technical analysis of this Daily chart of NIKKEI225 $ FULL0622 indicates that the overall trend is strongly bearish. 85.71% of the signals given by moving averages are bearish. The overall trend is supported by the strong bearish signals from short-term moving averages. The Central Indicators scanner detects bearish signals on moving averages that could impact this trend:
Bearish price crossover with Moving Average 20
Type : Bearish
Timeframe : Daily
Bearish price crossover with Moving Average 50
Type : Bearish
Timeframe : Daily
Bearish price crossover with adaptative moving average 20
Type : Bearish
Timeframe : Daily
Bearish price crossover with adaptative moving average 50
Type : Bearish
Timeframe : Daily
An assessment of technical indicators does not currently provide any relevant information to suggest whether the signal given by the technical indicators is more bullish or bearish.
Other results related to technical indicators were also found by the Central Indicators scanner:
Pivot points : price is under support 1
Type : Neutral
Timeframe : Daily
RSI indicator is back under 50
Type : Bearish
Timeframe : Daily
MACD crosses UP its Moving Average
Type : Bullish
Timeframe : Daily
Parabolic SAR indicator bullish reversal
Type : Bullish
Timeframe : Daily
Momentum indicator is back under 0
Type : Bearish
Timeframe : Daily
The analysis of the price chart with Central Patterns scanners does not return any result.
The Central Candlesticks scanner which studies Japanese candlesticks did not detect anything.
| S3 | S2 | S1 | Price | R1 | R2 | R3 | |
|---|---|---|---|---|---|---|---|
| ProTrendLines | 23,442 | 24,670 | 26,100 | 26,540 | 26,990 | 28,380 | 29,735 |
| Change (%) | -11.67% | -7.05% | -1.66% | - | +1.70% | +6.93% | +12.04% |
| Change | -3,098 | -1,870 | -440 | - | +450 | +1,840 | +3,195 |
| Level | Major | Intermediate | Minor | - | Major | Minor | Intermediate |
To determine price objectives, it is also possible to use the pivot points. Here is the price position in relation to pivot points:
| Pivot points | S3 | S2 | S1 | PP | R1 | R2 | R3 |
|---|---|---|---|---|---|---|---|
| Standard | 26,150 | 26,305 | 26,575 | 26,730 | 27,000 | 27,155 | 27,425 |
| Camarilla | 26,728 | 26,767 | 26,806 | 26,845 | 26,884 | 26,923 | 26,962 |
| Woodie | 26,208 | 26,334 | 26,633 | 26,759 | 27,058 | 27,184 | 27,483 |
| Fibonacci | 26,305 | 26,467 | 26,568 | 26,730 | 26,892 | 26,993 | 27,155 |
| Pivot points | S3 | S2 | S1 | PP | R1 | R2 | R3 |
|---|---|---|---|---|---|---|---|
| Standard | 24,675 | 25,115 | 25,905 | 26,345 | 27,135 | 27,575 | 28,365 |
| Camarilla | 26,357 | 26,470 | 26,582 | 26,695 | 26,808 | 26,921 | 27,033 |
| Woodie | 24,850 | 25,203 | 26,080 | 26,433 | 27,310 | 27,663 | 28,540 |
| Fibonacci | 25,115 | 25,585 | 25,875 | 26,345 | 26,815 | 27,105 | 27,575 |
| Pivot points | S3 | S2 | S1 | PP | R1 | R2 | R3 |
|---|---|---|---|---|---|---|---|
| Standard | 23,750 | 24,875 | 25,820 | 26,945 | 27,890 | 29,015 | 29,960 |
| Camarilla | 26,196 | 26,386 | 26,575 | 26,765 | 26,955 | 27,145 | 27,334 |
| Woodie | 23,660 | 24,830 | 25,730 | 26,900 | 27,800 | 28,970 | 29,870 |
| Fibonacci | 24,875 | 25,666 | 26,154 | 26,945 | 27,736 | 28,224 | 29,015 |
Numerical data
The following are the details of the technical indicators and moving averages that were collected to generate this technical analysis:
| RSI (14): | 49.00 | |
| MACD (12,26,9): | -131.0000 | |
| Directional Movement: | 4 | |
| AROON (14): | -42 | |
| DEMA (21): | 26,467 | |
| Parabolic SAR (0,02-0,02-0,2): | 25,555 | |
| Elder Ray (13): | 256 | |
| Super Trend (3,10): | 27,643 | |
| Zig ZAG (10): | 26,555 | |
| VORTEX (21): | 1.0000 | |
| Stochastique (14,3,5): | 56.00 | |
| TEMA (21): | 26,376 | |
| Williams %R (14): | -49.00 | |
| Chande Momentum Oscillator (20): | -335 | |
| Repulse (5,40,3): | -1.0000 | |
| ROCnROLL: | -1 | |
| TRIX (15,9): | 0.0000 | |
| Courbe Coppock: | 3.00 |
| MA7: | 26,339 | |
| MA20: | 26,647 | |
| MA50: | 26,838 | |
| MA100: | 27,056 | |
| MAexp7: | 26,513 | |
| MAexp20: | 26,638 | |
| MAexp50: | 26,820 | |
| MAexp100: | 27,119 | |
| Price / MA7: | +0.76% | |
| Price / MA20: | -0.40% | |
| Price / MA50: | -1.11% | |
| Price / MA100: | -1.91% | |
| Price / MAexp7: | +0.10% | |
| Price / MAexp20: | -0.37% | |
| Price / MAexp50: | -1.04% | |
| Price / MAexp100: | -2.14% |
About author

Online


Add a comment
Comments
0 comments on the analysis NIKKEI225 $ FULL0624 - Daily