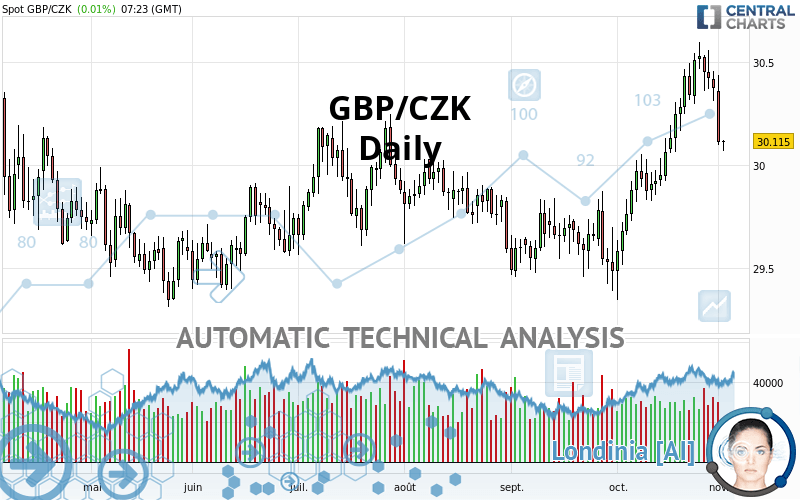
GBP/CZK - Daily - Technical analysis published on 11/02/2021 (GMT)
- 184
- 0
Click here for a new analysis!
- Timeframe : Daily
- - Analysis generated on
- Status : INVALID

Summary of the analysis

Additional analysis
Quotes
GBP/CZK rating 30.115 CZK. The price registered an increase of +0.01% on the session and was traded between 30.069 CZK and 30.119 CZK over the period. The price is currently at +0.15% from its lowest and -0.01% from its highest.Here is a more detailed summary of the historical variations registered by GBP/CZK:
Technical
A technical analysis in Daily of this GBP/CZK chart shows a bullish trend. 71.43% of the signals given by moving averages are bullish. Caution: the neutral signals currently given by short-term moving averages show us that the global trend is losing momentum. The Central Indicators scanner detects bearish signals on moving averages that could impact this trend:
Bearish trend reversal : adaptative moving average 20
Type : Bearish
Timeframe : Daily
Bearish price crossover with Moving Average 20
Type : Bearish
Timeframe : Daily
Bearish price crossover with adaptative moving average 20
Type : Bearish
Timeframe : Daily
Bearish price crossover with adaptative moving average 100
Type : Bearish
Timeframe : Daily
The technical indicators are generally neutral. They do not provide relevant information on the direction of future price movements.
Other results related to technical indicators were also found by the Central Indicators scanner:
Pivot points : price is under support 3
Type : Neutral
Timeframe : Weekly
MACD crosses DOWN its Moving Average
Type : Bearish
Timeframe : Daily
Price is back under the pivot point
Type : Bearish
Timeframe : Daily
Williams %R indicator is back under -50
Type : Bearish
Timeframe : Daily
The Central Patterns scanner, which studies chart patterns, resistances and supports, has identified these signals:
Near horizontal support
Type : Bullish
Timeframe : Daily
Support of channel is broken
Type : Bearish
Timeframe : Daily
The Central Candlesticks scanner which studies Japanese candlesticks did not detect anything.
| S3 | S2 | S1 | Price | R1 | R2 | R3 | |
|---|---|---|---|---|---|---|---|
| ProTrendLines | 29.490 | 29.648 | 29.887 | 30.115 | 30.213 | 30.526 | 30.690 |
| Change (%) | -2.08% | -1.55% | -0.76% | - | +0.33% | +1.36% | +1.91% |
| Change | -0.625 | -0.467 | -0.228 | - | +0.098 | +0.411 | +0.575 |
| Level | Intermediate | Minor | Intermediate | - | Major | Major | Minor |
To determine price objectives, it is also possible to use the pivot points. Here is the price position in relation to pivot points:
| Pivot points | S3 | S2 | S1 | PP | R1 | R2 | R3 |
|---|---|---|---|---|---|---|---|
| Standard | 29.654 | 29.874 | 29.993 | 30.213 | 30.332 | 30.552 | 30.671 |
| Camarilla | 30.018 | 30.049 | 30.080 | 30.111 | 30.142 | 30.173 | 30.204 |
| Woodie | 29.603 | 29.849 | 29.942 | 30.188 | 30.281 | 30.527 | 30.620 |
| Fibonacci | 29.874 | 30.004 | 30.084 | 30.213 | 30.343 | 30.423 | 30.552 |
| Pivot points | S3 | S2 | S1 | PP | R1 | R2 | R3 |
|---|---|---|---|---|---|---|---|
| Standard | 29.952 | 30.125 | 30.250 | 30.423 | 30.548 | 30.721 | 30.846 |
| Camarilla | 30.293 | 30.320 | 30.348 | 30.375 | 30.402 | 30.430 | 30.457 |
| Woodie | 29.928 | 30.113 | 30.226 | 30.411 | 30.524 | 30.709 | 30.822 |
| Fibonacci | 30.125 | 30.239 | 30.309 | 30.423 | 30.537 | 30.607 | 30.721 |
| Pivot points | S3 | S2 | S1 | PP | R1 | R2 | R3 |
|---|---|---|---|---|---|---|---|
| Standard | 28.365 | 28.856 | 29.615 | 30.106 | 30.865 | 31.356 | 32.115 |
| Camarilla | 30.031 | 30.146 | 30.260 | 30.375 | 30.490 | 30.604 | 30.719 |
| Woodie | 28.500 | 28.923 | 29.750 | 30.173 | 31.000 | 31.423 | 32.250 |
| Fibonacci | 28.856 | 29.333 | 29.628 | 30.106 | 30.583 | 30.878 | 31.356 |
Numerical data
The following is the status of technical indicators and moving averages registered at the time this technical analysis was created:
| RSI (14): | 50.48 | |
| MACD (12,26,9): | 0.1330 | |
| Directional Movement: | 1.753 | |
| AROON (14): | 64.286 | |
| DEMA (21): | 30.348 | |
| Parabolic SAR (0,02-0,02-0,2): | 30.571 | |
| Elder Ray (13): | -0.143 | |
| Super Trend (3,10): | 29.974 | |
| Zig ZAG (10): | 30.093 | |
| VORTEX (21): | 1.1480 | |
| Stochastique (14,3,5): | 44.51 | |
| TEMA (21): | 30.401 | |
| Williams %R (14): | -72.56 | |
| Chande Momentum Oscillator (20): | 0.030 | |
| Repulse (5,40,3): | -0.9120 | |
| ROCnROLL: | -1 | |
| TRIX (15,9): | 0.0790 | |
| Courbe Coppock: | 2.62 |
| MA7: | 30.355 | |
| MA20: | 30.172 | |
| MA50: | 29.863 | |
| MA100: | 29.868 | |
| MAexp7: | 30.260 | |
| MAexp20: | 30.168 | |
| MAexp50: | 29.985 | |
| MAexp100: | 29.895 | |
| Price / MA7: | -0.79% | |
| Price / MA20: | -0.19% | |
| Price / MA50: | +0.84% | |
| Price / MA100: | +0.83% | |
| Price / MAexp7: | -0.48% | |
| Price / MAexp20: | -0.18% | |
| Price / MAexp50: | +0.43% | |
| Price / MAexp100: | +0.74% |
About author

Online


Add a comment
Comments
0 comments on the analysis GBP/CZK - Daily