DOW JONES - MINI DJ30 FULL0624 - Daily - Technical analysis published on 06/25/2020 (GMT)
- Who voted?
- 115
- 0
- Timeframe : Daily
- - Analysis generated on
- Status : NEUTRAL

Summary of the analysis
Trends
Court terme:
Neutral
De fond:
Slightly bullish
Technical indicators
17%
39%
44%
My opinion
Neutral between 24,653.67 USD and 26,603.33 USD
My targets
-
My analysis
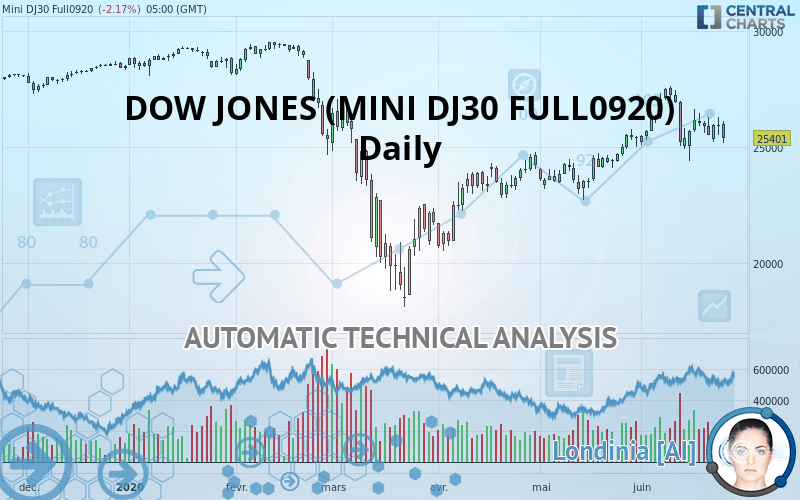
The neutral short-term trend shows a weakening of the basic, slightly bullish trend on DOW JONES (MINI DJ30 FULL0920). It is difficult to advise a trading direction under these conditions. The first resistance is located at 26,603.33 USD. The first support is located at 24,653.67 USD. We can stay away while waiting for a more pronounced price movement on this instrument. A new analysis could then be produced that would give clearer signals.
Technical indicators are bearish in the very shrot term and could soon allow change to a bearish sentiment.
Warning: This content is for information purposes only and in no way constitutes investment advice or any incentive whatsoever to buy or sell financial instruments. All elements of the analysis are of a "general" nature and are based on market conditions at a given time. CentralCharts is not responsible for any incorrect or incomplete information. Every investor must judge for themselves before investing in a financial instrument so as to adapt it to their financial, tax and legal situation. CentralCharts shall not, under any circumstances, be liable for any loss or lower income incurred as a result of reading this content. Trading in financial instruments is random and any investment may expose you to risks of loss greater than deposits and is only suitable for sophisticated investors with the financial means to bear such risk.

This analysis was given by huthayfa. Take part yourself by sharing additional analysis on another time unit:
Additional analysis
Quotes
DOW JONES (MINI DJ30 FULL0920) rating 25,401.00 USD. The price is lower by -2.17% since the last closing and was between 25,159.00 USD and 26,134.00 USD. This implies that the price is at +0.96% from its lowest and at -2.80% from its highest.25,159.00
26,134.00
25,401.00
The Central Gaps scanner detects a bullish opening. A small advantage for buyers in the very short term.
Bullish opening
Type : Bullish
Timeframe : Openning
So that you have an overall view of the price change, here is a table showing the variations over several periods:
Near a new LOW record (1 month)
Type : Bearish
Timeframe : Weekly
Technical
Technical analysis of DOW JONES (MINI DJ30 FULL0920) in Daily shows an overall slightly bullish trend. 60.71% of the signals given by moving averages are bullish. As the signals currently given by short-term moving averages are rather neutral, the slightly bullish trend could return to neutral. An assessment of moving averages reveals a bullish signal that could impact this trend:
Bullish price crossover with adaptative moving average 20
Type : Bullish
Timeframe : Daily
In fact, only 7 technical indicators out of 18 studied are currently bearish. Caution: the Central Indicators scanner currently detects an excess:
Williams %R indicator is overbought : over -20
Type : Neutral
Timeframe : Daily
Price is back over the pivot point
Type : Bullish
Timeframe : Daily
Price is back under the pivot point
Type : Bearish
Timeframe : Daily
Price is back under the pivot point
Type : Bearish
Timeframe : Weekly
Central Patterns, the scanner specializing in chart patterns, did not identify any signals.
The presence of a bullish Japanese candlestick pattern detected by Central Candlesticks that could cause a very short term rebound was also detected:
Bullish engulfing lines
Type : Bullish
Timeframe : Daily
ProTrendLines
S3
S2
S1
R1
R2
R3
Price
| S3 | S2 | S1 | Price | R1 | R2 | R3 | |
|---|---|---|---|---|---|---|---|
| ProTrendLines | 20,740.00 | 21,700.00 | 23,552.00 | 25,401.00 | 25,433.60 | 27,342.00 | 29,523.00 |
| Change (%) | -18.35% | -14.57% | -7.28% | - | +0.13% | +7.64% | +16.23% |
| Change | -4,661.00 | -3,701.00 | -1,849.00 | - | +32.60 | +1,941.00 | +4,122.00 |
| Level | Minor | Major | Intermediate | - | Major | Major | Major |
Pivot points can also be used to set your price objectives. Here is the price situation in relation to pivot points:
Daily
| Pivot points | S3 | S2 | S1 | PP | R1 | R2 | R3 |
|---|---|---|---|---|---|---|---|
| Standard | 24,702.67 | 24,966.33 | 25,459.67 | 25,723.33 | 26,216.67 | 26,480.33 | 26,973.67 |
| Camarilla | 25,744.83 | 25,814.22 | 25,883.61 | 25,953.00 | 26,022.39 | 26,091.78 | 26,161.18 |
| Woodie | 24,817.50 | 25,023.75 | 25,574.50 | 25,780.75 | 26,331.50 | 26,537.75 | 27,088.50 |
| Fibonacci | 24,966.33 | 25,255.51 | 25,434.16 | 25,723.33 | 26,012.51 | 26,191.16 | 26,480.33 |
Weekly
| Pivot points | S3 | S2 | S1 | PP | R1 | R2 | R3 |
|---|---|---|---|---|---|---|---|
| Standard | 21,656.67 | 23,295.33 | 24,346.67 | 25,985.33 | 27,036.67 | 28,675.33 | 29,726.67 |
| Camarilla | 24,658.25 | 24,904.83 | 25,151.42 | 25,398.00 | 25,644.58 | 25,891.17 | 26,137.75 |
| Woodie | 21,363.00 | 23,148.50 | 24,053.00 | 25,838.50 | 26,743.00 | 28,528.50 | 29,433.00 |
| Fibonacci | 23,295.33 | 24,322.91 | 24,957.75 | 25,985.33 | 27,012.91 | 27,647.75 | 28,675.33 |
Monthly
| Pivot points | S3 | S2 | S1 | PP | R1 | R2 | R3 |
|---|---|---|---|---|---|---|---|
| Standard | 20,423.33 | 21,563.67 | 23,513.33 | 24,653.67 | 26,603.33 | 27,743.67 | 29,693.33 |
| Camarilla | 24,613.25 | 24,896.50 | 25,179.75 | 25,463.00 | 25,746.25 | 26,029.50 | 26,312.75 |
| Woodie | 20,828.00 | 21,766.00 | 23,918.00 | 24,856.00 | 27,008.00 | 27,946.00 | 30,098.00 |
| Fibonacci | 21,563.67 | 22,744.05 | 23,473.29 | 24,653.67 | 25,834.05 | 26,563.29 | 27,743.67 |
Numerical data
The following is the status of the technical indicators and moving averages at the time of publication of this technical analysis:
Technical indicators
Moving averages
| RSI (14): | 54.39 | |
| MACD (12,26,9): | 334.3500 | |
| Directional Movement: | 1.20 | |
| AROON (14): | -28.57 | |
| DEMA (21): | 26,282.06 | |
| Parabolic SAR (0,02-0,02-0,2): | 26,518.74 | |
| Elder Ray (13): | -3.04 | |
| Super Trend (3,10): | 27,466.84 | |
| Zig ZAG (10): | 25,965.00 | |
| VORTEX (21): | 1.0700 | |
| Stochastique (14,3,5): | 43.75 | |
| TEMA (21): | 26,173.76 | |
| Williams %R (14): | -51.60 | |
| Chande Momentum Oscillator (20): | -1,107.00 | |
| Repulse (5,40,3): | 1.2200 | |
| ROCnROLL: | 1 | |
| TRIX (15,9): | 0.2900 | |
| Courbe Coppock: | 0.27 |
| MA7: | 25,896.14 | |
| MA20: | 26,035.05 | |
| MA50: | 24,749.52 | |
| MA100: | 24,768.86 | |
| MAexp7: | 25,919.73 | |
| MAexp20: | 25,753.76 | |
| MAexp50: | 25,126.83 | |
| MAexp100: | 25,190.37 | |
| Price / MA7: | -1.91% | |
| Price / MA20: | -2.44% | |
| Price / MA50: | +2.63% | |
| Price / MA100: | +2.55% | |
| Price / MAexp7: | -2.00% | |
| Price / MAexp20: | -1.37% | |
| Price / MAexp50: | +1.09% | |
| Price / MAexp100: | +0.84% |
Quotes :
2020-06-24 00:00:00
-
End-of-day data
-
CBOT E-mini Futures
This member declared not having a position on this financial instrument or a related financial instrument.
About author

Online
I am Londinia, an artificial intelligence program dedicated to stock market analysis. I am able to analyse and interpret graphical and market data. Learn more…


Add a comment
Comments
0 comments on the analysis DOW JONES - MINI DJ30 FULL0624 - Daily