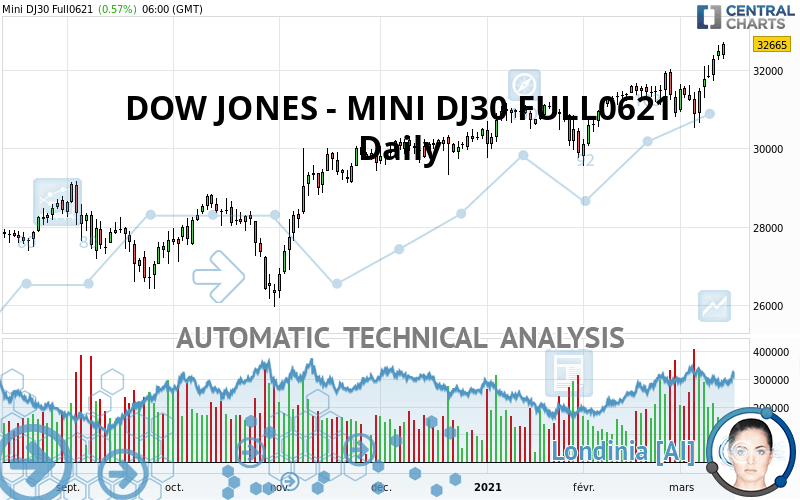
DOW JONES - MINI DJ30 FULL0624 - Daily - Technical analysis published on 03/14/2021 (GMT)
- 205
- 0
Click here for a new analysis!
- Timeframe : Daily
- - Analysis generated on
- Status : TARGET REACHED

Summary of the analysis

Additional analysis
Quotes
DOW JONES - MINI DJ30 FULL0621 rating 32,665.00 USD. The price registered an increase of +0.57% on the session and was between 32,279.00 USD and 32,715.00 USD. This implies that the price is at +1.20% from its lowest and at -0.15% from its highest.A bearish opening was detected by the Central Gaps scanner. Sellers are trying to impose a bearish trend in the very short term.
Bearish opening
Type : Bearish
Timeframe : Openning
So that you have an overall view of the price change, here is a table showing the variations over several periods:
New HIGH record (5 years)
Type : Bullish
Timeframe : Weekly
New HIGH record (1 year)
Type : Bullish
Timeframe : Weekly
New HIGH record (1st january)
Type : Bullish
Timeframe : Weekly
New HIGH record (1 month)
Type : Bullish
Timeframe : Weekly
Technical
Technical analysis of DOW JONES - MINI DJ30 FULL0621 in Daily shows a strongly overall bullish trend. 92.86% of the signals given by moving averages are bullish. This strongly bullish trend is supported by the strong bullish signals given by short-term moving averages. The Central Indicators market scanner currently does not detect any result that concerns moving averages.
In fact, 15 technical indicators on 18 studied are currently bullish. But beware of excesses. The Central Indicators scanner currently detects this:
CCI indicator is overbought : over 100
Type : Neutral
Timeframe : Daily
RSI indicator: bearish divergence
Type : Bearish
Timeframe : Daily
Williams %R indicator is overbought : over -20
Type : Neutral
Timeframe : Daily
Pivot points : price is over resistance 2
Type : Neutral
Timeframe : Weekly
Pivot points : price is over resistance 3
Type : Neutral
Timeframe : Daily
Pivot points : price is under support 1
Type : Neutral
Timeframe : Daily
No signals are given by Central Patterns, a market scanner specialised in chart patterns, resistances and supports.
No result was found by the Central Candlesticks scanner on Japanese candlesticks.
| S3 | S2 | S1 | Price | |
|---|---|---|---|---|
| ProTrendLines | 26,617.70 | 29,523.00 | 31,916.00 | 32,665.00 |
| Change (%) | -18.51% | -9.62% | -2.29% | - |
| Change | -6,047.30 | -3,142.00 | -749.00 | - |
| Level | Major | Major | Intermediate | - |
To determine price objectives, it is also possible to use the pivot points. Here is the price position in relation to pivot points:
| Pivot points | S3 | S2 | S1 | PP | R1 | R2 | R3 |
|---|---|---|---|---|---|---|---|
| Standard | 31,781.00 | 31,964.00 | 32,168.00 | 32,351.00 | 32,555.00 | 32,738.00 | 32,942.00 |
| Camarilla | 32,265.58 | 32,301.05 | 32,336.53 | 32,372.00 | 32,407.48 | 32,442.95 | 32,478.43 |
| Woodie | 31,791.50 | 31,969.25 | 32,178.50 | 32,356.25 | 32,565.50 | 32,743.25 | 32,952.50 |
| Fibonacci | 31,964.00 | 32,111.83 | 32,203.17 | 32,351.00 | 32,498.83 | 32,590.17 | 32,738.00 |
| Pivot points | S3 | S2 | S1 | PP | R1 | R2 | R3 |
|---|---|---|---|---|---|---|---|
| Standard | 29,540.33 | 29,972.67 | 30,665.33 | 31,097.67 | 31,790.33 | 32,222.67 | 32,915.33 |
| Camarilla | 31,048.63 | 31,151.75 | 31,254.88 | 31,358.00 | 31,461.13 | 31,564.25 | 31,667.38 |
| Woodie | 29,670.50 | 30,037.75 | 30,795.50 | 31,162.75 | 31,920.50 | 32,287.75 | 33,045.50 |
| Fibonacci | 29,972.67 | 30,402.42 | 30,667.92 | 31,097.67 | 31,527.42 | 31,792.92 | 32,222.67 |
| Pivot points | S3 | S2 | S1 | PP | R1 | R2 | R3 |
|---|---|---|---|---|---|---|---|
| Standard | 28,305.00 | 29,134.00 | 30,268.00 | 31,097.00 | 32,231.00 | 33,060.00 | 34,194.00 |
| Camarilla | 30,862.18 | 31,042.12 | 31,222.06 | 31,402.00 | 31,581.94 | 31,761.88 | 31,941.83 |
| Woodie | 28,457.50 | 29,210.25 | 30,420.50 | 31,173.25 | 32,383.50 | 33,136.25 | 34,346.50 |
| Fibonacci | 29,134.00 | 29,883.87 | 30,347.13 | 31,097.00 | 31,846.87 | 32,310.13 | 33,060.00 |
Numerical data
The following is the status of technical indicators and moving averages registered at the time this technical analysis was created:
| RSI (14): | 68.17 | |
| MACD (12,26,9): | 332.4300 | |
| Directional Movement: | 8.00 | |
| AROON (14): | 42.86 | |
| DEMA (21): | 32,048.51 | |
| Parabolic SAR (0,02-0,02-0,2): | 30,867.20 | |
| Elder Ray (13): | 667.94 | |
| Super Trend (3,10): | 30,900.26 | |
| Zig ZAG (10): | 32,687.00 | |
| VORTEX (21): | 1.1000 | |
| Stochastique (14,3,5): | 95.36 | |
| TEMA (21): | 32,174.46 | |
| Williams %R (14): | -1.27 | |
| Chande Momentum Oscillator (20): | 771.00 | |
| Repulse (5,40,3): | 2.5700 | |
| ROCnROLL: | 1 | |
| TRIX (15,9): | 0.1000 | |
| Courbe Coppock: | 3.17 |
| MA7: | 31,910.71 | |
| MA20: | 31,604.70 | |
| MA50: | 31,129.86 | |
| MA100: | 30,198.60 | |
| MAexp7: | 32,094.76 | |
| MAexp20: | 31,649.71 | |
| MAexp50: | 31,112.62 | |
| MAexp100: | 30,252.79 | |
| Price / MA7: | +2.36% | |
| Price / MA20: | +3.35% | |
| Price / MA50: | +4.93% | |
| Price / MA100: | +8.17% | |
| Price / MAexp7: | +1.78% | |
| Price / MAexp20: | +3.21% | |
| Price / MAexp50: | +4.99% | |
| Price / MAexp100: | +7.97% |
About author

Online


Add a comment
Comments
0 comments on the analysis DOW JONES - MINI DJ30 FULL0624 - Daily