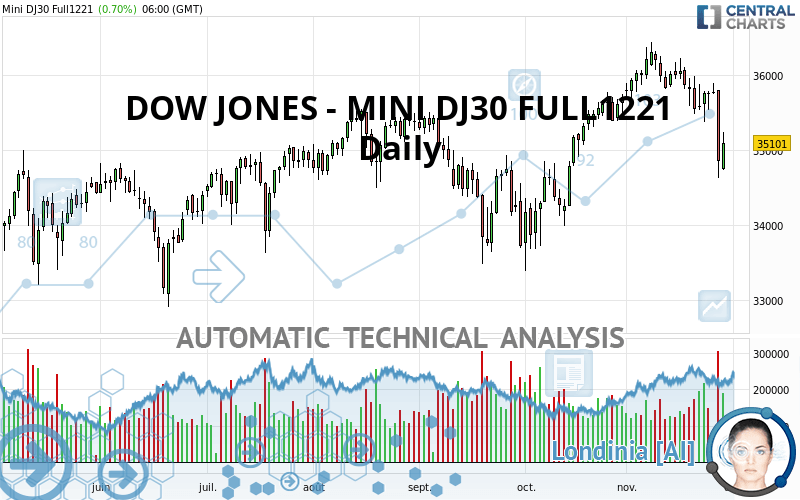
DOW JONES - MINI DJ30 FULL0624 - Daily - Technical analysis published on 11/29/2021 (GMT)
- 128
- 0
Click here for a new analysis!
- Timeframe : Daily
- - Analysis generated on
- Status : TARGET REACHED

Summary of the analysis

Additional analysis
Quotes
The DOW JONES - MINI DJ30 FULL1221 rating is 35,110.00 USD. The price has increased by +0.72% since the last closing and was traded between 34,740.00 USD and 35,246.00 USD over the period. The price is currently at +1.07% from its lowest and -0.39% from its highest.The Central Gaps scanner detects a bearish opening marking the presence of sellers ahead of buyers at the opening but not sufficiently marked to allow the price to register a quotation gap.
Bearish opening
Type : Bearish
Timeframe : Openning
A study of price movements over other periods shows the following variations:
Near a new HIGH record (5 years)
Type : Bullish
Timeframe : Weekly
Near a new HIGH record (1st january)
Type : Bullish
Timeframe : Weekly
Technical
Technical analysis of DOW JONES - MINI DJ30 FULL1221 in Daily shows a neutral overall trend. The trend could quickly turn bearish due to the strong bearish signals currently being given by short-term moving averages. An assessment of moving averages reveals several bearish signals that could impact this trend:
Bearish trend reversal : Moving Average 20
Type : Bearish
Timeframe : Daily
Bearish trend reversal : adaptative moving average 20
Type : Bearish
Timeframe : Daily
Bearish trend reversal : adaptative moving average 50
Type : Bearish
Timeframe : Daily
Bearish price crossover with Moving Average 50
Type : Bearish
Timeframe : Daily
Bearish price crossover with Moving Average 100
Type : Bearish
Timeframe : Daily
Bearish price crossover with adaptative moving average 50
Type : Bearish
Timeframe : Daily
Bearish price crossover with adaptative moving average 100
Type : Bearish
Timeframe : Daily
In fact, 14 technical indicators on 18 studied are currently bearish. Caution: the Central Indicators scanner currently detects an excess:
CCI indicator is oversold : under -100
Type : Neutral
Timeframe : Daily
Williams %R indicator is oversold : under -80
Type : Neutral
Timeframe : Daily
RSI indicator is back under 50
Type : Bearish
Timeframe : Daily
SuperTrend indicator bearish reversal
Type : Bearish
Timeframe : Daily
Price is back under the pivot point
Type : Bearish
Timeframe : Daily
Price is back under the pivot point
Type : Bearish
Timeframe : Weekly
No signals are given by Central Patterns, a market scanner specialised in chart patterns, resistances and supports.
The presence of these bearish patterns in Japanese candlesticks detected by Central Candlesticks that could cause a correction in the very short term were also noted
Black line without upper shadow
Type : Bearish
Timeframe : Daily
Long black line
Type : Bearish
Timeframe : Daily
Bearish engulfing lines
Type : Bearish
Timeframe : Daily
| S3 | S2 | S1 | Price | R1 | R2 | |
|---|---|---|---|---|---|---|
| ProTrendLines | 32,306.00 | 33,743.70 | 34,724.00 | 35,110.00 | 35,528.30 | 36,312.00 |
| Change (%) | -7.99% | -3.89% | -1.10% | - | +1.19% | +3.42% |
| Change | -2,804.00 | -1,366.30 | -386.00 | - | +418.30 | +1,202.00 |
| Level | Minor | Major | Major | - | Major | Intermediate |
Pivot points can also be used to set your price objectives. Here is the price situation in relation to pivot points:
| Pivot points | S3 | S2 | S1 | PP | R1 | R2 | R3 |
|---|---|---|---|---|---|---|---|
| Standard | 33,202.00 | 33,914.00 | 34,386.00 | 35,098.00 | 35,570.00 | 36,282.00 | 36,754.00 |
| Camarilla | 34,532.40 | 34,640.93 | 34,749.47 | 34,858.00 | 34,966.53 | 35,075.07 | 35,183.60 |
| Woodie | 33,082.00 | 33,854.00 | 34,266.00 | 35,038.00 | 35,450.00 | 36,222.00 | 36,634.00 |
| Fibonacci | 33,914.00 | 34,366.29 | 34,645.71 | 35,098.00 | 35,550.29 | 35,829.71 | 36,282.00 |
| Pivot points | S3 | S2 | S1 | PP | R1 | R2 | R3 |
|---|---|---|---|---|---|---|---|
| Standard | 33,082.00 | 33,854.00 | 34,356.00 | 35,128.00 | 35,630.00 | 36,402.00 | 36,904.00 |
| Camarilla | 34,507.65 | 34,624.43 | 34,741.22 | 34,858.00 | 34,974.78 | 35,091.57 | 35,208.35 |
| Woodie | 32,947.00 | 33,786.50 | 34,221.00 | 35,060.50 | 35,495.00 | 36,334.50 | 36,769.00 |
| Fibonacci | 33,854.00 | 34,340.67 | 34,641.33 | 35,128.00 | 35,614.67 | 35,915.33 | 36,402.00 |
| Pivot points | S3 | S2 | S1 | PP | R1 | R2 | R3 |
|---|---|---|---|---|---|---|---|
| Standard | 32,147.00 | 32,914.00 | 34,357.00 | 35,124.00 | 36,567.00 | 37,334.00 | 38,777.00 |
| Camarilla | 35,192.25 | 35,394.83 | 35,597.42 | 35,800.00 | 36,002.58 | 36,205.17 | 36,407.75 |
| Woodie | 32,485.00 | 33,083.00 | 34,695.00 | 35,293.00 | 36,905.00 | 37,503.00 | 39,115.00 |
| Fibonacci | 32,914.00 | 33,758.22 | 34,279.78 | 35,124.00 | 35,968.22 | 36,489.78 | 37,334.00 |
Numerical data
The following is the status of the technical indicators and moving averages at the time of publication of this technical analysis:
| RSI (14): | 38.24 | |
| MACD (12,26,9): | -22.5200 | |
| Directional Movement: | -20.59 | |
| AROON (14): | -92.86 | |
| DEMA (21): | 35,657.48 | |
| Parabolic SAR (0,02-0,02-0,2): | 35,900.00 | |
| Elder Ray (13): | -576.44 | |
| Super Trend (3,10): | 36,214.69 | |
| Zig ZAG (10): | 35,021.00 | |
| VORTEX (21): | 0.9000 | |
| Stochastique (14,3,5): | 25.37 | |
| TEMA (21): | 35,444.57 | |
| Williams %R (14): | -75.02 | |
| Chande Momentum Oscillator (20): | -793.00 | |
| Repulse (5,40,3): | -1.4200 | |
| ROCnROLL: | 2 | |
| TRIX (15,9): | 0.0600 | |
| Courbe Coppock: | 3.28 |
| MA7: | 35,475.71 | |
| MA20: | 35,829.55 | |
| MA50: | 35,202.10 | |
| MA100: | 35,080.29 | |
| MAexp7: | 35,420.92 | |
| MAexp20: | 35,600.61 | |
| MAexp50: | 35,389.95 | |
| MAexp100: | 35,016.09 | |
| Price / MA7: | -1.03% | |
| Price / MA20: | -2.01% | |
| Price / MA50: | -0.26% | |
| Price / MA100: | +0.08% | |
| Price / MAexp7: | -0.88% | |
| Price / MAexp20: | -1.38% | |
| Price / MAexp50: | -0.79% | |
| Price / MAexp100: | +0.27% |
About author

Online


Add a comment
Comments
0 comments on the analysis DOW JONES - MINI DJ30 FULL0624 - Daily