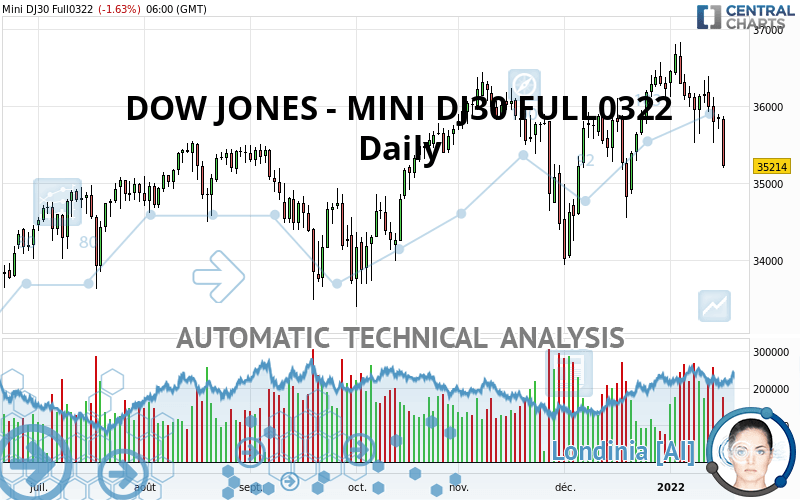
DOW JONES - MINI DJ30 FULL0624 - Daily - Technical analysis published on 01/18/2022 (GMT)
- 161
- 0
Click here for a new analysis!
- Timeframe : Daily
- - Analysis generated on
- Status : TARGET REACHED

Summary of the analysis

Additional analysis
Quotes
The DOW JONES - MINI DJ30 FULL0322 rating is 35,214.00 USD. The price registered a decrease of -1.63% on the session and was traded between 35,194.00 USD and 35,865.00 USD over the period. The price is currently at +0.06% from its lowest and -1.82% from its highest.A bullish opening was detected by the Central Gaps scanner. Buyers are trying to impose a bullish momentum in the very short term.
Bullish opening
Type : Bullish
Timeframe : Openning
So that you have an overall view of the price change, here is a table showing the variations over several periods:
Near a new HIGH record (5 years)
Type : Bullish
Timeframe : Weekly
Near a new HIGH record (1 year)
Type : Bullish
Timeframe : Weekly
Near a new HIGH record (1st january)
Type : Bullish
Timeframe : Weekly
New LOW record (1st january)
Type : Bearish
Timeframe : Weekly
Technical
Technical analysis of this Daily chart of DOW JONES - MINI DJ30 FULL0322 indicates that the overall trend is slightly bearish. Only 57.14% of the signals given by moving averages are bearish. This slightly bearish trend is not supported by the signals currently being given by short-term moving averages. The Central Indicators market scanner is currently detecting several bearish signals that could impact this trend:
Bearish price crossover with Moving Average 50
Type : Bearish
Timeframe : Daily
Bearish price crossover with Moving Average 100
Type : Bearish
Timeframe : Daily
Bearish price crossover with adaptative moving average 20
Type : Bearish
Timeframe : Daily
An assessment of technical indicators does not currently provide any relevant information on the direction of future price movements.
Caution: the Central Indicators scanner currently detects an excess:
CCI indicator is oversold : under -100
Type : Neutral
Timeframe : Daily
Williams %R indicator is oversold : under -80
Type : Neutral
Timeframe : Daily
Pivot points : price is under support 1
Type : Neutral
Timeframe : Weekly
Pivot points : price is under support 3
Type : Neutral
Timeframe : Daily
SuperTrend indicator bearish reversal
Type : Bearish
Timeframe : Daily
Central Patterns, the scanner specializing in chart patterns, did not identify any signals.
The Central Candlesticks scanner which studies Japanese candlesticks did not detect anything.
| S3 | S2 | S1 | Price | R1 | R2 | R3 | |
|---|---|---|---|---|---|---|---|
| ProTrendLines | 33,155.00 | 33,743.70 | 34,735.80 | 35,214.00 | 35,521.40 | 35,865.80 | 36,312.00 |
| Change (%) | -5.85% | -4.18% | -1.36% | - | +0.87% | +1.85% | +3.12% |
| Change | -2,059.00 | -1,470.30 | -478.20 | - | +307.40 | +651.80 | +1,098.00 |
| Level | Minor | Major | Intermediate | - | Intermediate | Major | Major |
Pivot points can also be used to set your price objectives. Here is the price situation in relation to pivot points:
| Pivot points | S3 | S2 | S1 | PP | R1 | R2 | R3 |
|---|---|---|---|---|---|---|---|
| Standard | 35,506.00 | 35,606.00 | 35,701.00 | 35,801.00 | 35,896.00 | 35,996.00 | 36,091.00 |
| Camarilla | 35,742.38 | 35,760.25 | 35,778.13 | 35,796.00 | 35,813.88 | 35,831.75 | 35,849.63 |
| Woodie | 35,503.50 | 35,604.75 | 35,698.50 | 35,799.75 | 35,893.50 | 35,994.75 | 36,088.50 |
| Fibonacci | 35,606.00 | 35,680.49 | 35,726.51 | 35,801.00 | 35,875.49 | 35,921.51 | 35,996.00 |
| Pivot points | S3 | S2 | S1 | PP | R1 | R2 | R3 |
|---|---|---|---|---|---|---|---|
| Standard | 34,535.67 | 35,025.33 | 35,410.67 | 35,900.33 | 36,285.67 | 36,775.33 | 37,160.67 |
| Camarilla | 35,555.38 | 35,635.58 | 35,715.79 | 35,796.00 | 35,876.21 | 35,956.42 | 36,036.63 |
| Woodie | 34,483.50 | 34,999.25 | 35,358.50 | 35,874.25 | 36,233.50 | 36,749.25 | 37,108.50 |
| Fibonacci | 35,025.33 | 35,359.58 | 35,566.08 | 35,900.33 | 36,234.58 | 36,441.08 | 36,775.33 |
| Pivot points | S3 | S2 | S1 | PP | R1 | R2 | R3 |
|---|---|---|---|---|---|---|---|
| Standard | 31,928.00 | 32,926.00 | 34,576.00 | 35,574.00 | 37,224.00 | 38,222.00 | 39,872.00 |
| Camarilla | 35,497.80 | 35,740.53 | 35,983.27 | 36,226.00 | 36,468.73 | 36,711.47 | 36,954.20 |
| Woodie | 32,254.00 | 33,089.00 | 34,902.00 | 35,737.00 | 37,550.00 | 38,385.00 | 40,198.00 |
| Fibonacci | 32,926.00 | 33,937.54 | 34,562.46 | 35,574.00 | 36,585.54 | 37,210.46 | 38,222.00 |
Numerical data
The following is the status of the technical indicators and moving averages at the time of publication of this technical analysis:
| RSI (14): | 38.46 | |
| MACD (12,26,9): | 28.0000 | |
| Directional Movement: | -16.17 | |
| AROON (14): | -64.29 | |
| DEMA (21): | 35,986.42 | |
| Parabolic SAR (0,02-0,02-0,2): | 36,634.95 | |
| Elder Ray (13): | -363.24 | |
| Super Trend (3,10): | 36,863.34 | |
| Zig ZAG (10): | 35,214.00 | |
| VORTEX (21): | 1.0000 | |
| Stochastique (14,3,5): | 14.45 | |
| TEMA (21): | 35,878.47 | |
| Williams %R (14): | -99.27 | |
| Chande Momentum Oscillator (20): | -1,025.00 | |
| Repulse (5,40,3): | -2.8900 | |
| ROCnROLL: | 2 | |
| TRIX (15,9): | 0.0600 | |
| Courbe Coppock: | 1.08 |
| MA7: | 35,862.86 | |
| MA20: | 36,044.30 | |
| MA50: | 35,669.50 | |
| MA100: | 35,250.06 | |
| MAexp7: | 35,784.96 | |
| MAexp20: | 35,893.56 | |
| MAexp50: | 35,685.95 | |
| MAexp100: | 35,306.09 | |
| Price / MA7: | -1.81% | |
| Price / MA20: | -2.30% | |
| Price / MA50: | -1.28% | |
| Price / MA100: | -0.10% | |
| Price / MAexp7: | -1.60% | |
| Price / MAexp20: | -1.89% | |
| Price / MAexp50: | -1.32% | |
| Price / MAexp100: | -0.26% |
About author

Online


Add a comment
Comments
0 comments on the analysis DOW JONES - MINI DJ30 FULL0624 - Daily