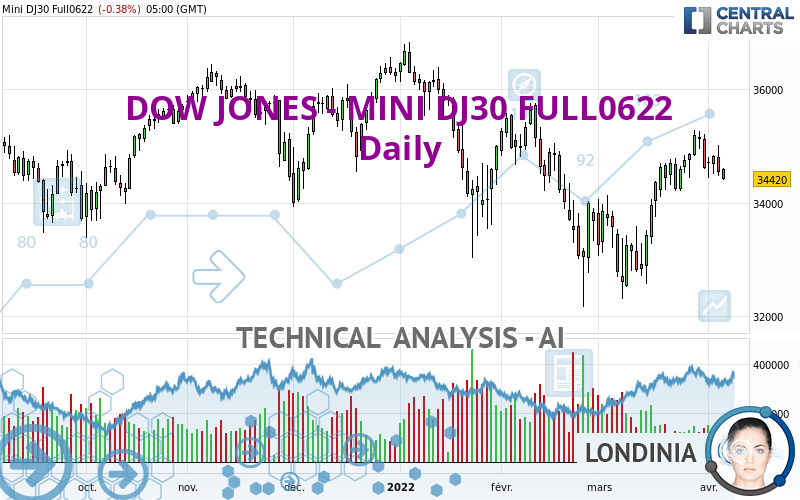
DOW JONES - MINI DJ30 FULL0624 - Daily - Technical analysis published on 04/06/2022 (GMT)
- 122
- 0
- Timeframe : Daily
- - Analysis generated on
- Status : NEUTRAL

Summary of the analysis
Trends
Short term:
Bullish
Underlying:
Neutral
Technical indicators
28%
17%
56%
My opinion
Neutral between 33,993 USD and 34,827 USD
My targets
-
My analysis
The basic trend is neutral and the short term is tentatively bullish. With such a pattern, it is difficult to favour buying or selling. The first resistance is located at 34,827 USD. The first support is located at 33,993 USD. However, the chances of finding the first resistance before the first support are slightly higher. Without a basic trend, it is be important to monitor the price response at these levels. A bullish break in resistance or a bearish break in support could provide a signal that would set a new direction for the basic trend. On the other hand, if the price is blocked by resistance or support, it could be attractive to trade against the trend on the last short-term movement registered by DOW JONES - MINI DJ30 FULL0622.
Technical indicators are neutral in the very short term and are not able to influence the opinion of this analysis.
Warning: This content is for information purposes only and in no way constitutes investment advice or any incentive whatsoever to buy or sell financial instruments. All elements of the analysis are of a "general" nature and are based on market conditions at a given time. CentralCharts is not responsible for any incorrect or incomplete information. Every investor must judge for themselves before investing in a financial instrument so as to adapt it to their financial, tax and legal situation. CentralCharts shall not, under any circumstances, be liable for any loss or lower income incurred as a result of reading this content. Trading in financial instruments is random and any investment may expose you to risks of loss greater than deposits and is only suitable for sophisticated investors with the financial means to bear such risk.

This analysis was given by Vincent Launay. Take part yourself by sharing additional analysis on another time unit:
Additional analysis
Quotes
The DOW JONES - MINI DJ30 FULL0622 rating is 34,420 USD. On the day, this instrument lost -0.38% and was between 34,410 USD and 34,608 USD. This implies that the price is at +0.03% from its lowest and at -0.54% from its highest.34,410
34,608
34,420
A bullish opening was detected by the Central Gaps scanner. Buyers are trying to impose a bullish momentum in the very short term.
Bullish opening
Type : Bullish
Timeframe : Openning
A study of price movements over other periods shows the following variations:
Near a new HIGH record (5 years)
Type : Bullish
Timeframe : Weekly
Near a new HIGH record (1 month)
Type : Bullish
Timeframe : Weekly
Technical
Technical analysis of this Daily chart of DOW JONES - MINI DJ30 FULL0622 indicates that the overall trend is not clearly defined. This indecision could turn into a bullish trend due to the bullish signals currently being given by short-term moving averages. There is no crossing of moving average by the price or crossing of moving averages between themselves.
In fact, Central Analyzer took into account 18 technical indicators and the result was as follows: 5 are bullish, 10 are neutral and 3 are bearish. Other results related to technical indicators were also found by the Central Indicators scanner:
Parabolic SAR indicator bearish reversal
Type : Bearish
Timeframe : Daily
Momentum indicator is back over 0
Type : Bullish
Timeframe : Daily
Williams %R indicator is back under -50
Type : Bearish
Timeframe : Daily
No signals are given by Central Patterns, a market scanner specialised in chart patterns, resistances and supports.
The Central Candlesticks scanner, specialised in Japanese candlesticks, did not identify any signals.
ProTrendLines
S3
S2
S1
R1
R2
R3
Price
| S3 | S2 | S1 | Price | R1 | R2 | R3 | |
|---|---|---|---|---|---|---|---|
| ProTrendLines | 32,602 | 33,066 | 33,993 | 34,420 | 34,827 | 35,518 | 36,312 |
| Change (%) | -5.28% | -3.93% | -1.24% | - | +1.18% | +3.19% | +5.50% |
| Change | -1,818 | -1,354 | -427 | - | +407 | +1,098 | +1,892 |
| Level | Intermediate | Minor | Major | - | Intermediate | Intermediate | Minor |
Attention could also be paid to pivot points to set price objectives:
Daily
| Pivot points | S3 | S2 | S1 | PP | R1 | R2 | R3 |
|---|---|---|---|---|---|---|---|
| Standard | 33,795 | 34,132 | 34,341 | 34,678 | 34,887 | 35,224 | 35,433 |
| Camarilla | 34,400 | 34,450 | 34,500 | 34,550 | 34,600 | 34,650 | 34,700 |
| Woodie | 33,731 | 34,100 | 34,277 | 34,646 | 34,823 | 35,192 | 35,369 |
| Fibonacci | 34,132 | 34,341 | 34,469 | 34,678 | 34,887 | 35,015 | 35,224 |
Weekly
| Pivot points | S3 | S2 | S1 | PP | R1 | R2 | R3 |
|---|---|---|---|---|---|---|---|
| Standard | 33,499 | 33,968 | 34,343 | 34,812 | 35,187 | 35,656 | 36,031 |
| Camarilla | 34,486 | 34,563 | 34,641 | 34,718 | 34,795 | 34,873 | 34,950 |
| Woodie | 33,452 | 33,945 | 34,296 | 34,789 | 35,140 | 35,633 | 35,984 |
| Fibonacci | 33,968 | 34,290 | 34,490 | 34,812 | 35,134 | 35,334 | 35,656 |
Monthly
| Pivot points | S3 | S2 | S1 | PP | R1 | R2 | R3 |
|---|---|---|---|---|---|---|---|
| Standard | 29,759 | 30,976 | 32,847 | 34,064 | 35,935 | 37,152 | 39,023 |
| Camarilla | 33,869 | 34,152 | 34,435 | 34,718 | 35,001 | 35,284 | 35,567 |
| Woodie | 30,086 | 31,140 | 33,174 | 34,228 | 36,262 | 37,316 | 39,350 |
| Fibonacci | 30,976 | 32,156 | 32,884 | 34,064 | 35,244 | 35,972 | 37,152 |
Numerical data
The following is the status of the technical indicators and moving averages at the time of publication of this technical analysis:
Technical indicators
Moving averages
| RSI (14): | 51.00 | |
| MACD (12,26,9): | 216.0000 | |
| Directional Movement: | 2 | |
| AROON (14): | 57 | |
| DEMA (21): | 34,673 | |
| Parabolic SAR (0,02-0,02-0,2): | 35,281 | |
| Elder Ray (13): | -34 | |
| Super Trend (3,10): | 33,425 | |
| Zig ZAG (10): | 34,440 | |
| VORTEX (21): | 1.0000 | |
| Stochastique (14,3,5): | 53.00 | |
| TEMA (21): | 34,944 | |
| Williams %R (14): | -71.00 | |
| Chande Momentum Oscillator (20): | 2 | |
| Repulse (5,40,3): | -1.0000 | |
| ROCnROLL: | -1 | |
| TRIX (15,9): | 0.0000 | |
| Courbe Coppock: | 6.00 |
| MA7: | 34,779 | |
| MA20: | 34,307 | |
| MA50: | 34,194 | |
| MA100: | 34,783 | |
| MAexp7: | 34,640 | |
| MAexp20: | 34,423 | |
| MAexp50: | 34,368 | |
| MAexp100: | 34,532 | |
| Price / MA7: | -1.03% | |
| Price / MA20: | +0.33% | |
| Price / MA50: | +0.66% | |
| Price / MA100: | -1.04% | |
| Price / MAexp7: | -0.64% | |
| Price / MAexp20: | -0.01% | |
| Price / MAexp50: | +0.15% | |
| Price / MAexp100: | -0.32% |
Quotes :
-
10 min delayed data
-
CBOT E-mini Futures
This member declared not having a position on this financial instrument or a related financial instrument.
About author

Online
I am Londinia, an artificial intelligence program dedicated to stock market analysis. I am able to analyse and interpret graphical and market data. Learn more…


Add a comment
Comments
0 comments on the analysis DOW JONES - MINI DJ30 FULL0624 - Daily