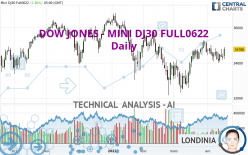
DOW JONES - MINI DJ30 FULL0624 - Daily - Technical analysis published on 04/19/2022 (GMT)
- 135
- 0
Click here for a new analysis!
- Timeframe : Daily
- - Analysis generated on
- Status : INVALID

Summary of the analysis

Additional analysis
Quotes
The DOW JONES - MINI DJ30 FULL0622 rating is 34,780 USD. The price has increased by +1.36% since the last closing with the lowest point at 34,226 USD and the highest point at 34,897 USD. The deviation from the price is +1.62% for the low point and -0.34% for the high point.The Central Gaps scanner detects a bullish opening marking the presence of buyers ahead of sellers at the opening but not sufficiently marked to allow the price to register a quotation gap.
Bullish opening
Type : Bullish
Timeframe : Openning
Here is a more detailed summary of the historical variations registered by DOW JONES - MINI DJ30 FULL0622:
Near a new LOW record (1 month)
Type : Bearish
Timeframe : Weekly
Technical
Technical analysis of DOW JONES - MINI DJ30 FULL0622 in Daily shows an overall bullish trend. The signals returned by the moving averages are 71.43% bullish. This bullish trend is reinforced by the strong signals currently being given by short-term moving averages. The Central Indicators market scanner is currently detecting several bullish signals that could impact this trend:
Bullish price crossover with Moving Average 20
Type : Bullish
Timeframe : Daily
Bullish price crossover with Moving Average 100
Type : Bullish
Timeframe : Daily
Bullish price crossover with adaptative moving average 100
Type : Bullish
Timeframe : Daily
The probability of a further increase are moderate given the direction of the technical indicators.
Central Indicators, the detector scanner for these technical indicators has recently detected several signals:
Pivot points : price is over resistance 1
Type : Neutral
Timeframe : Weekly
Pivot points : price is over resistance 2
Type : Neutral
Timeframe : Daily
RSI indicator is back over 50
Type : Bullish
Timeframe : Daily
Parabolic SAR indicator bullish reversal
Type : Bullish
Timeframe : Daily
Ichimoku : price is over the cloud
Type : Bullish
Timeframe : Daily
Momentum indicator is back over 0
Type : Bullish
Timeframe : Daily
Williams %R indicator is back over -50
Type : Bullish
Timeframe : Daily
No signals are given by Central Patterns, a market scanner specialised in chart patterns, resistances and supports.
No result was found by the Central Candlesticks scanner on Japanese candlesticks.
| S3 | S2 | S1 | Price | R1 | R2 | R3 | |
|---|---|---|---|---|---|---|---|
| ProTrendLines | 32,954 | 33,522 | 34,524 | 34,780 | 35,189 | 36,107 | 36,563 |
| Change (%) | -5.25% | -3.62% | -0.74% | - | +1.18% | +3.82% | +5.13% |
| Change | -1,826 | -1,258 | -256 | - | +409 | +1,327 | +1,783 |
| Level | Minor | Major | Intermediate | - | Major | Minor | Major |
To determine price objectives, it is also possible to use the pivot points. Here is the price position in relation to pivot points:
| Pivot points | S3 | S2 | S1 | PP | R1 | R2 | R3 |
|---|---|---|---|---|---|---|---|
| Standard | 33,800 | 33,990 | 34,151 | 34,341 | 34,502 | 34,692 | 34,853 |
| Camarilla | 34,216 | 34,249 | 34,281 | 34,313 | 34,345 | 34,377 | 34,410 |
| Woodie | 33,787 | 33,983 | 34,138 | 34,334 | 34,489 | 34,685 | 34,840 |
| Fibonacci | 33,990 | 34,124 | 34,207 | 34,341 | 34,475 | 34,558 | 34,692 |
| Pivot points | S3 | S2 | S1 | PP | R1 | R2 | R3 |
|---|---|---|---|---|---|---|---|
| Standard | 33,183 | 33,593 | 33,975 | 34,385 | 34,767 | 35,177 | 35,559 |
| Camarilla | 34,140 | 34,213 | 34,285 | 34,358 | 34,431 | 34,503 | 34,576 |
| Woodie | 33,170 | 33,586 | 33,962 | 34,378 | 34,754 | 35,170 | 35,546 |
| Fibonacci | 33,593 | 33,895 | 34,082 | 34,385 | 34,687 | 34,874 | 35,177 |
| Pivot points | S3 | S2 | S1 | PP | R1 | R2 | R3 |
|---|---|---|---|---|---|---|---|
| Standard | 29,759 | 30,976 | 32,847 | 34,064 | 35,935 | 37,152 | 39,023 |
| Camarilla | 33,869 | 34,152 | 34,435 | 34,718 | 35,001 | 35,284 | 35,567 |
| Woodie | 30,086 | 31,140 | 33,174 | 34,228 | 36,262 | 37,316 | 39,350 |
| Fibonacci | 30,976 | 32,156 | 32,884 | 34,064 | 35,244 | 35,972 | 37,152 |
Numerical data
The following are the details of the technical indicators and moving averages that were collected to generate this technical analysis:
| RSI (14): | 56.00 | |
| MACD (12,26,9): | 87.0000 | |
| Directional Movement: | 4 | |
| AROON (14): | -71 | |
| DEMA (21): | 34,560 | |
| Parabolic SAR (0,02-0,02-0,2): | 34,002 | |
| Elder Ray (13): | 88 | |
| Super Trend (3,10): | 33,425 | |
| Zig ZAG (10): | 34,780 | |
| VORTEX (21): | 1.0000 | |
| Stochastique (14,3,5): | 38.00 | |
| TEMA (21): | 34,613 | |
| Williams %R (14): | -38.00 | |
| Chande Momentum Oscillator (20): | 162 | |
| Repulse (5,40,3): | 1.0000 | |
| ROCnROLL: | 1 | |
| TRIX (15,9): | 0.0000 | |
| Courbe Coppock: | 2.00 |
| MA7: | 34,415 | |
| MA20: | 34,600 | |
| MA50: | 34,132 | |
| MA100: | 34,703 | |
| MAexp7: | 34,486 | |
| MAexp20: | 34,428 | |
| MAexp50: | 34,383 | |
| MAexp100: | 34,516 | |
| Price / MA7: | +1.06% | |
| Price / MA20: | +0.52% | |
| Price / MA50: | +1.90% | |
| Price / MA100: | +0.22% | |
| Price / MAexp7: | +0.85% | |
| Price / MAexp20: | +1.02% | |
| Price / MAexp50: | +1.15% | |
| Price / MAexp100: | +0.76% |
About author

Online


Add a comment
Comments
0 comments on the analysis DOW JONES - MINI DJ30 FULL0624 - Daily